Preprocessing of single multi-omic dataset
[ ]:
import csv
import numpy as np
import pandas as pd
import scanpy as sc
import scvelo as scv
import matplotlib.pyplot as plt
import multivelovae as vv
[2]:
scv.settings.verbosity = 3
scv.settings.presenter_view = True
scv.set_figure_params('scvelo')
pd.set_option('display.max_columns', 100)
pd.set_option('display.max_rows', 200)
np.set_printoptions(suppress=True)
[3]:
# Define cell cycle genes
s_genes_list = \
    ['Mcm5', 'Pcna', 'Tyms', 'Fen1', 'Mcm2', 'Mcm4', 'Rrm1', 'Ung', 'Gins2',
     'Mcm6', 'Cdca7', 'Dtl', 'Prim1', 'Uhrf1', 'CENPU', 'Hells', 'Rfc2',
     'Rpa2', 'Nasp', 'Rad51ap1', 'Gmnn', 'Wdr76', 'Slbp', 'Ccne2', 'Ubr7',
     'Pold3', 'Msh2', 'Atad2', 'Rad51', 'Rrm2', 'Cdc45', 'Cdc6', 'Exo1', 'Tipin',
     'Dscc1', 'Blm', 'Casp8ap2', 'Usp1', 'Clspn', 'Pola1', 'Chaf1b', 'Brip1', 'E2f8']

g2m_genes_list = \
    ['Hmgb2', 'Cdk1', 'Nusap1', 'Ube2c', 'Birc5', 'Tpx2', 'Top2a', 'Ndc80',
     'Cks2', 'Nuf2', 'Cks1b', 'Mki67', 'Tmpo', 'Cenpf', 'Tacc3', 'PIMREG',
     'Smc4', 'Ccnb2', 'Ckap2l', 'Ckap2', 'Aurkb', 'Bub1', 'Kif11', 'Anp32e',
     'Tubb4b', 'Gtse1', 'Kif20b', 'Hjurp', 'Cdca3', 'JPT1', 'Cdc20', 'Ttk',
     'Cdc25c', 'Kif2c', 'Rangap1', 'Ncapd2', 'Dlgap5', 'Cdca2', 'Cdca8',
     'Ect2', 'Kif23', 'Hmmr', 'Aurka', 'Psrc1', 'Anln', 'Lbr', 'Ckap5',
     'Cenpe', 'Ctcf', 'Nek2', 'G2e3', 'Gas2l3', 'Cbx5', 'Cenpa']
s_genes_list = np.array([x.upper() for x in s_genes_list])
g2m_genes_list = np.array([x.upper() for x in g2m_genes_list])
[4]:
# Define hemoglobin genes
hb_genes = np.array(['HBA1', 'HBA2', 'HBB', 'HBD', 'HBE1', 'HBG1', 'HBG2', 'HBQ1', 'HBM', 'HBZ'])
[5]:
# Define marker genes for various cell types
marker_genes = np.array(['PROM1', 'CRHBP', 'HLF', 'FAM30A',  # HSC
                         'AZU1', 'MPO', 'PRSS57',  # GMP
                         'SPINK2', 'C1QTNF4',  # LMPP
                         'LYZ', 'VCAN', 'S100A8',  # cDC
                         'CSTA', 'FCN1', 'CD14',  # Monocyte
                         'TCF4', 'IRF8', 'SPIB',  # pDC
                         'SLC40A1',  # MEP
                         'HBB', 'HBD', 'KLF1', 'CA1',  # Erythrocyte
                         'HDC', 'PRG2', 'LMO4', 'SLC45A3', 'IKZF2',  # Granulocyte
                         'RHEX', 'SIGLEC6', 'HPGDS', 'TPSAB1',  # Mast Cells
                         'ELANE',  # NK
                         'IL7R',  # Prog T
                         'CD72', 'DNTT', 'EBF1',  # Prog B
                         'FCER1A', 'F2R',  # Megakaryocyte
                         'PLEK', 'PPBP', 'ITGA2B', 'PF4', 'TUBB1',  # Platelet
                         'FABP4', 'CD36',  # Adipocyte
                         'LYST', 'C1QC', 'CD86', 'SPP1', 'GPNMB', 'MRC1', 'CTSS', 'FTL'  # Macrophage
                         ])
Preprocess ATAC counts
[6]:
adata_atac_ = sc.read_10x_mtx('filtered_feature_bc_matrix/', var_names='gene_symbols', cache=True, gex_only=False)
adata_atac_ = adata_atac_[:,adata_atac_.var['feature_types'] == "Peaks"]
adata_atac_
[6]:
View of AnnData object with n_obs × n_vars = 10067 × 165654
    var: 'gene_ids', 'feature_types'
[7]:
adata_atac_ = vv.aggregate_peaks_10x(adata_atac_,
                                     'atac_peak_annotation.tsv',
                                     'analysis/feature_linkage/feature_linkage.bedpe',
                                     verbose=True)
CellRanger ARC identified as 2.0.0
Found 20885 genes with promoter peaks
[8]:
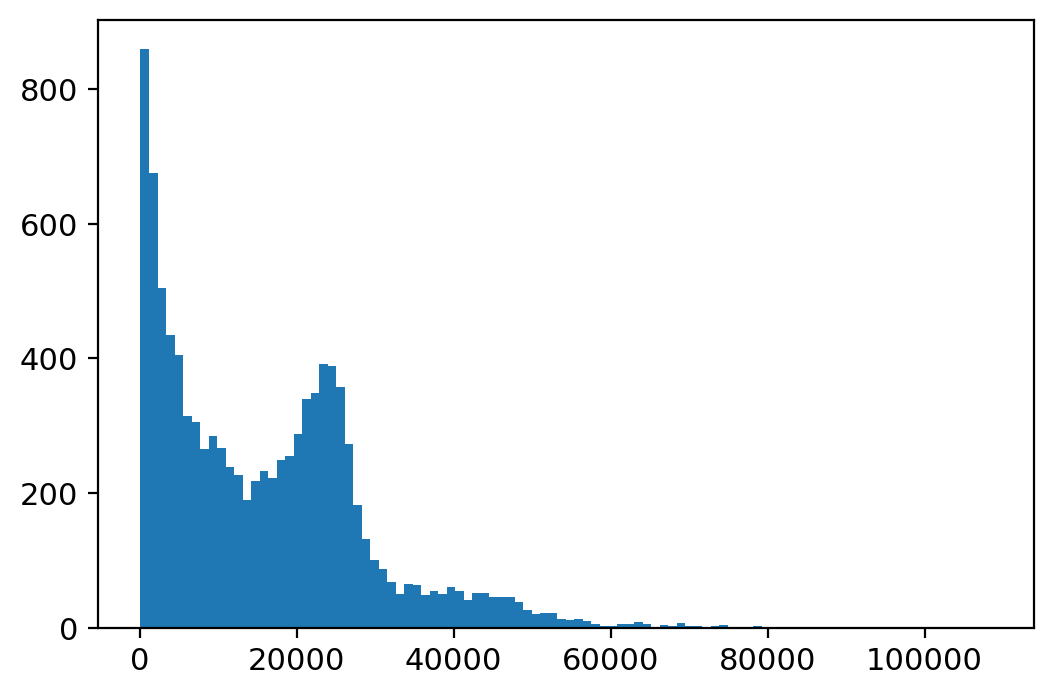
plt.hist(adata_atac_.X.sum(1), bins=100);
[9]:
sc.pp.filter_cells(adata_atac_, min_counts=5000)
Preprocess RNA counts
[10]:
adata_ = sc.read_10x_mtx('filtered_feature_bc_matrix/', var_names='gene_symbols', cache=True, gex_only=True)
adata_.var_names_make_unique()
[11]:
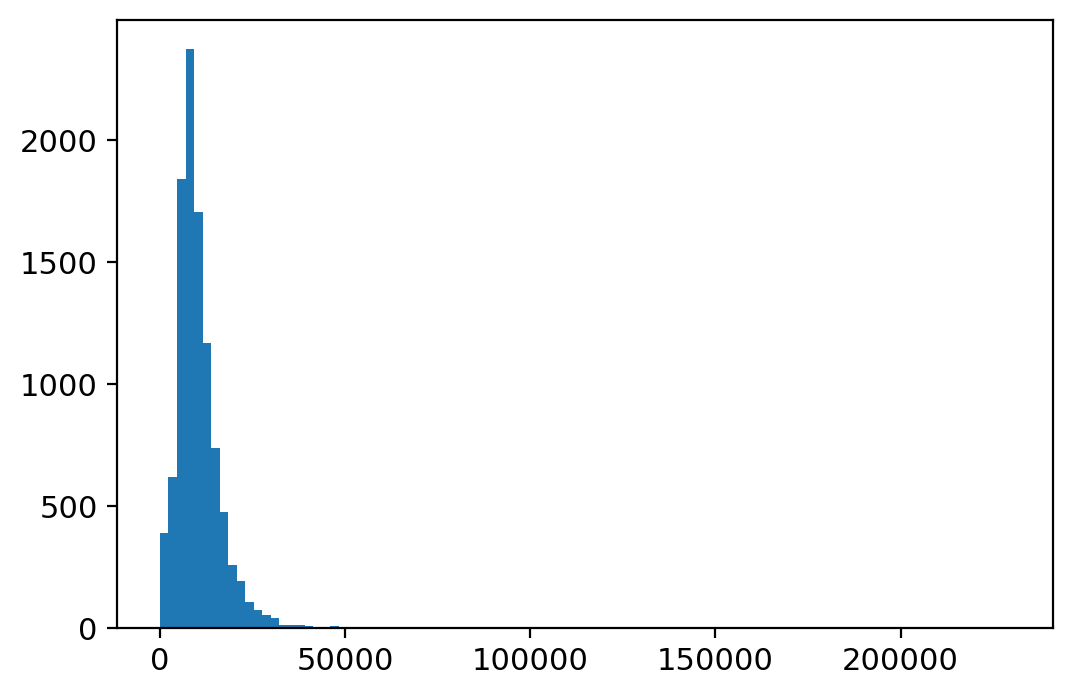
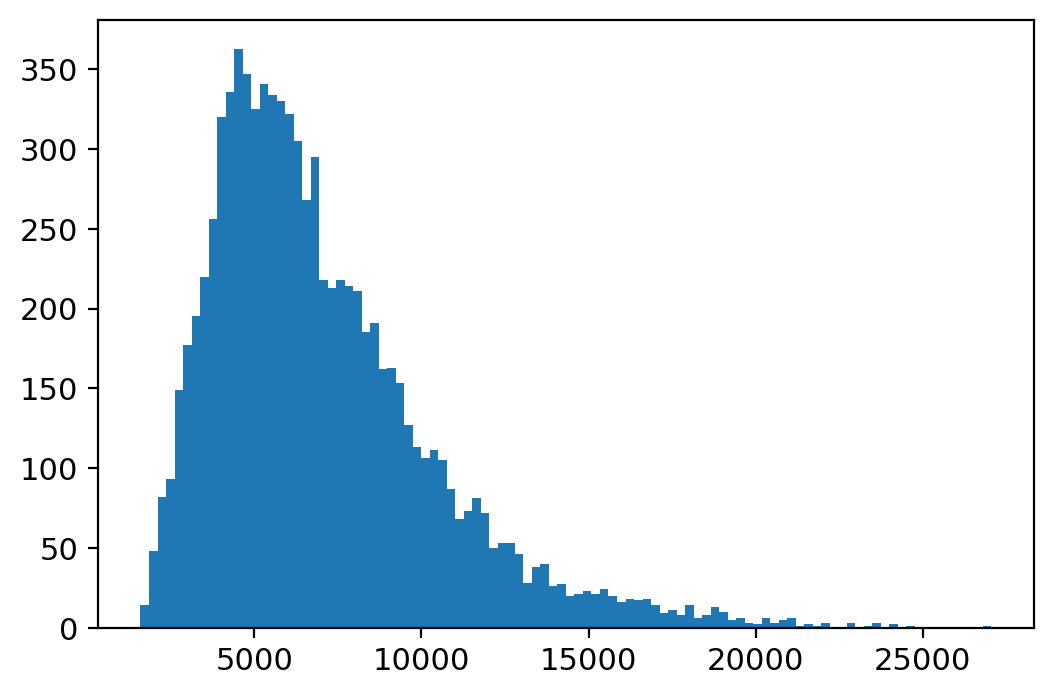
plt.hist(adata_.X.sum(1), bins=100);
[12]:
sc.pp.filter_cells(adata_, min_genes=500)
sc.pp.filter_genes(adata_, min_cells=10)
[13]:
# Compute QC metrics
adata_.var['mt'] = adata_.var_names.str.startswith('MT-')
adata_.var['rb'] = adata_.var_names.str.startswith(('RPS', 'RPL'))
adata_.var['hla'] = adata_.var_names.str.startswith('HLA-')
adata_.var['hb'] = np.in1d(adata_.var_names, hb_genes)
sc.pp.calculate_qc_metrics(adata_, qc_vars=['mt', 'rb', 'hla', 'hb'], percent_top=[20], log1p=True, inplace=True)
[14]:
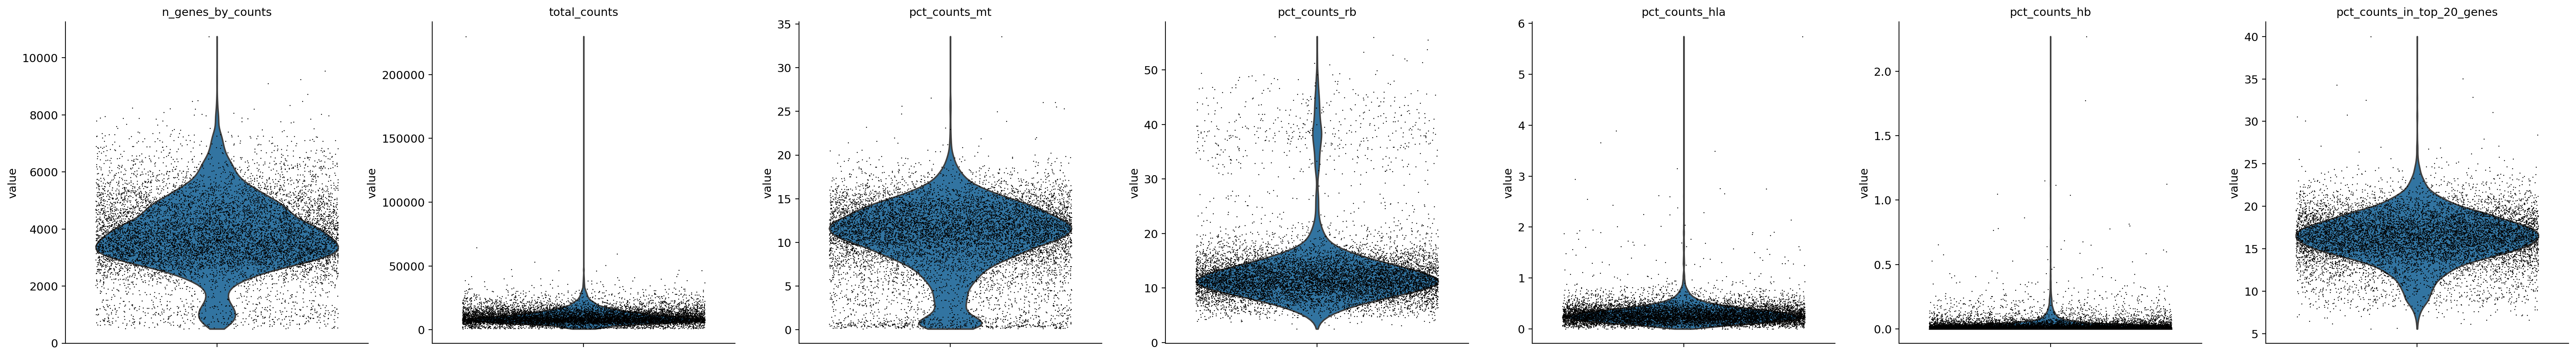
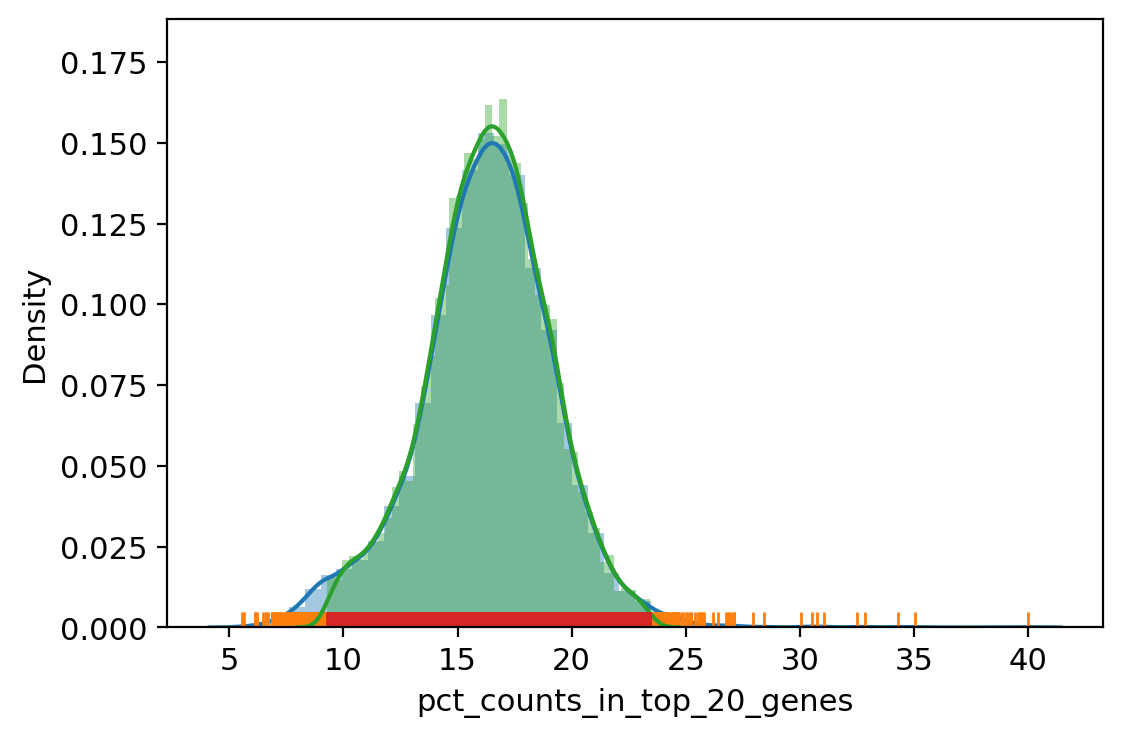
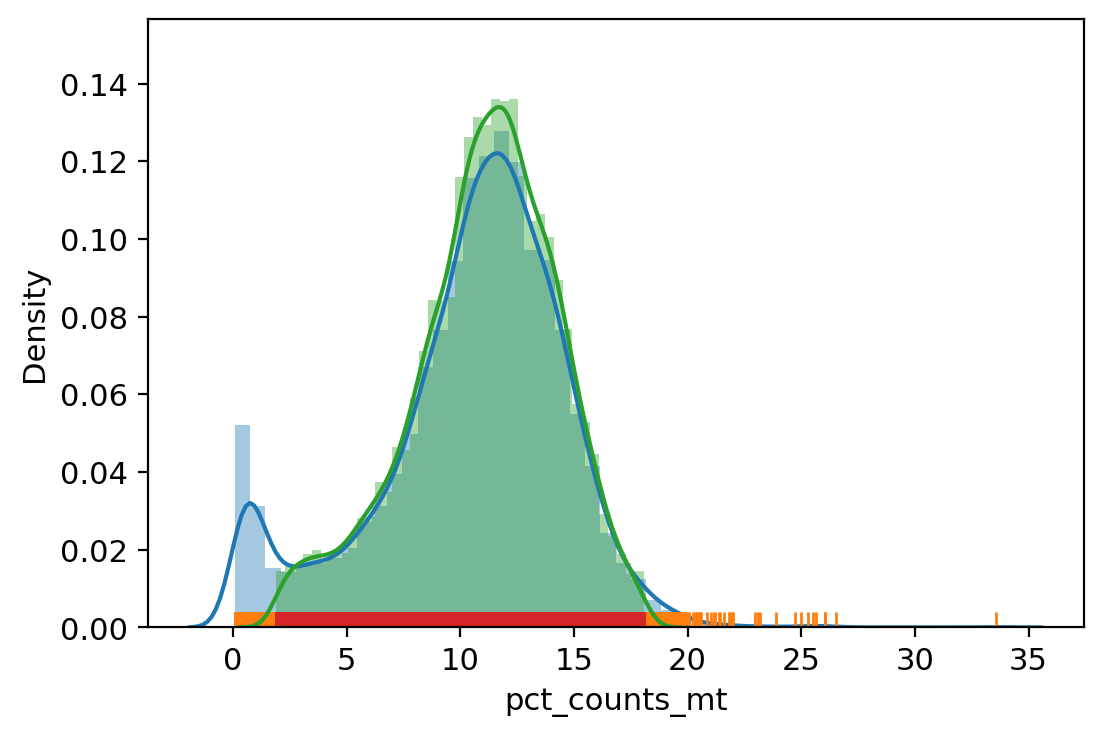
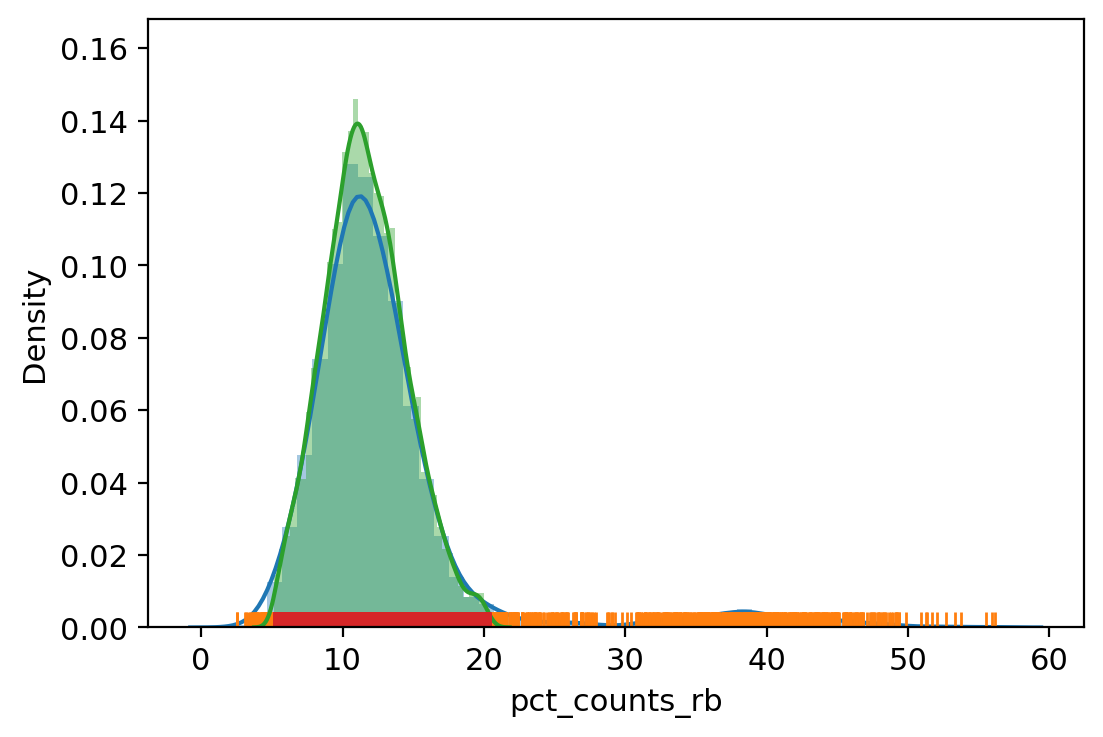
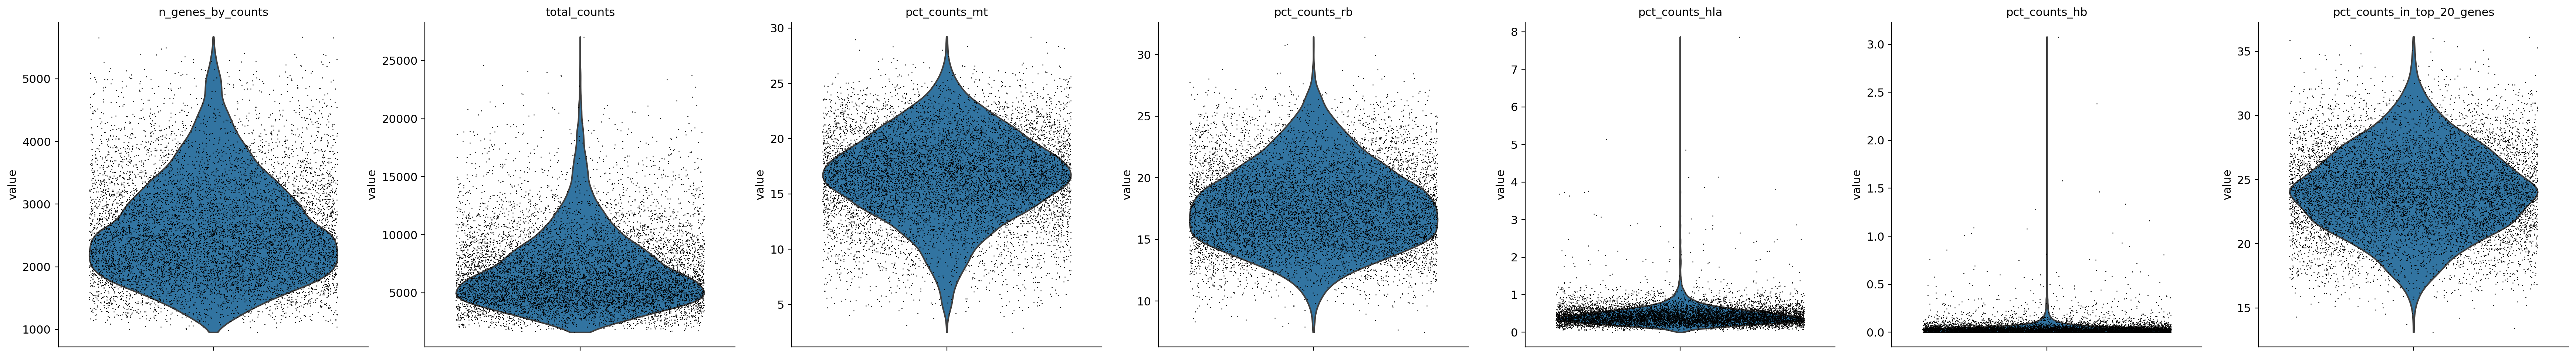
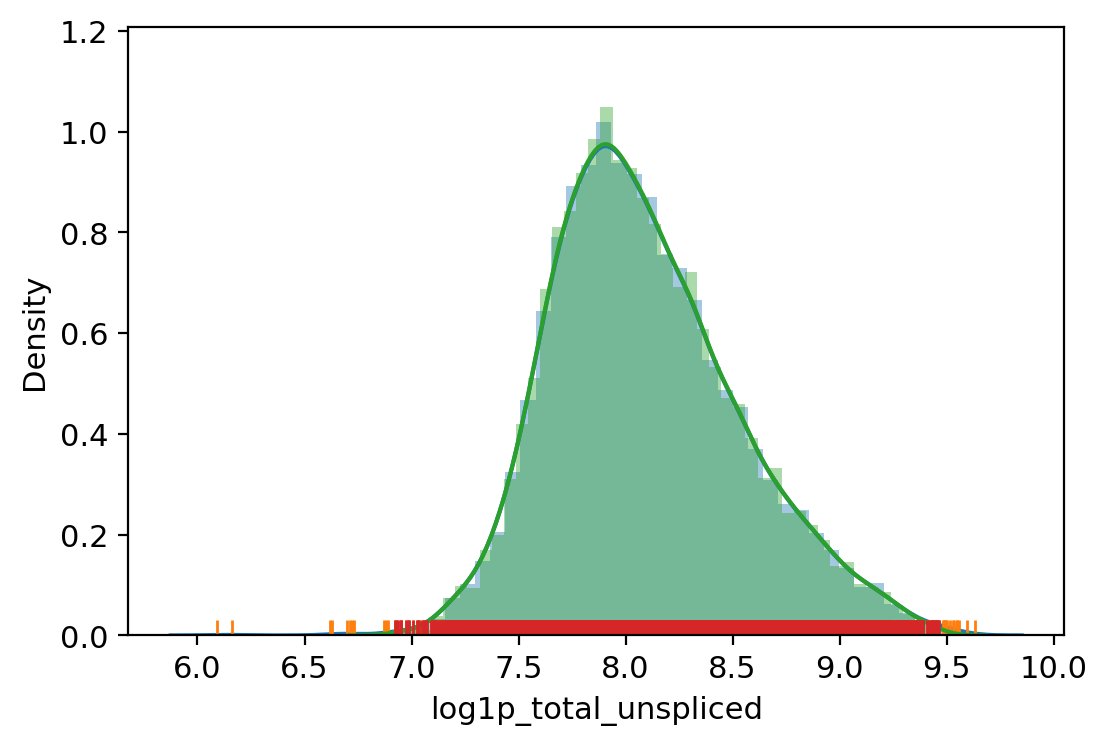
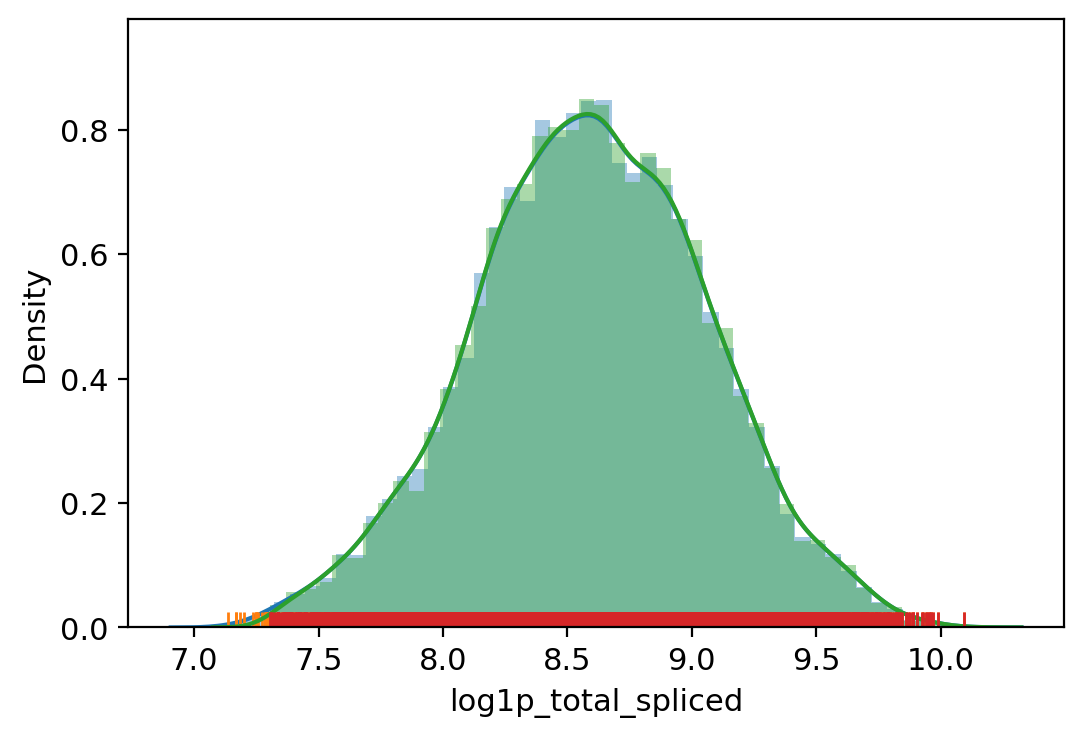
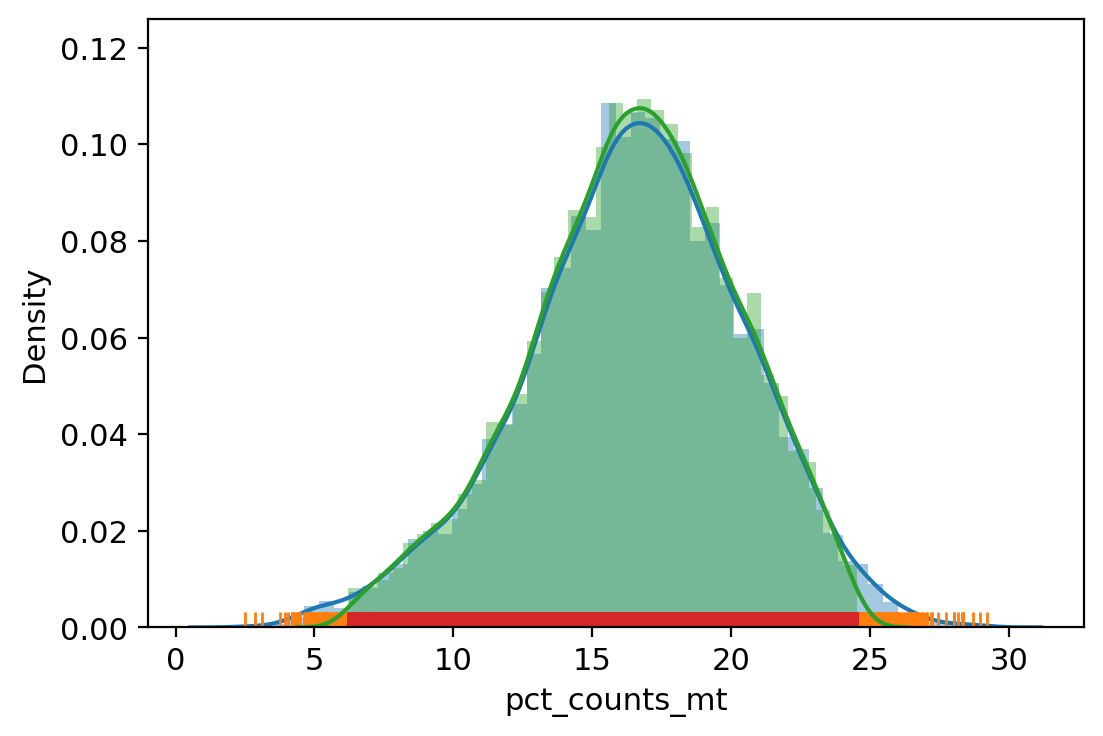
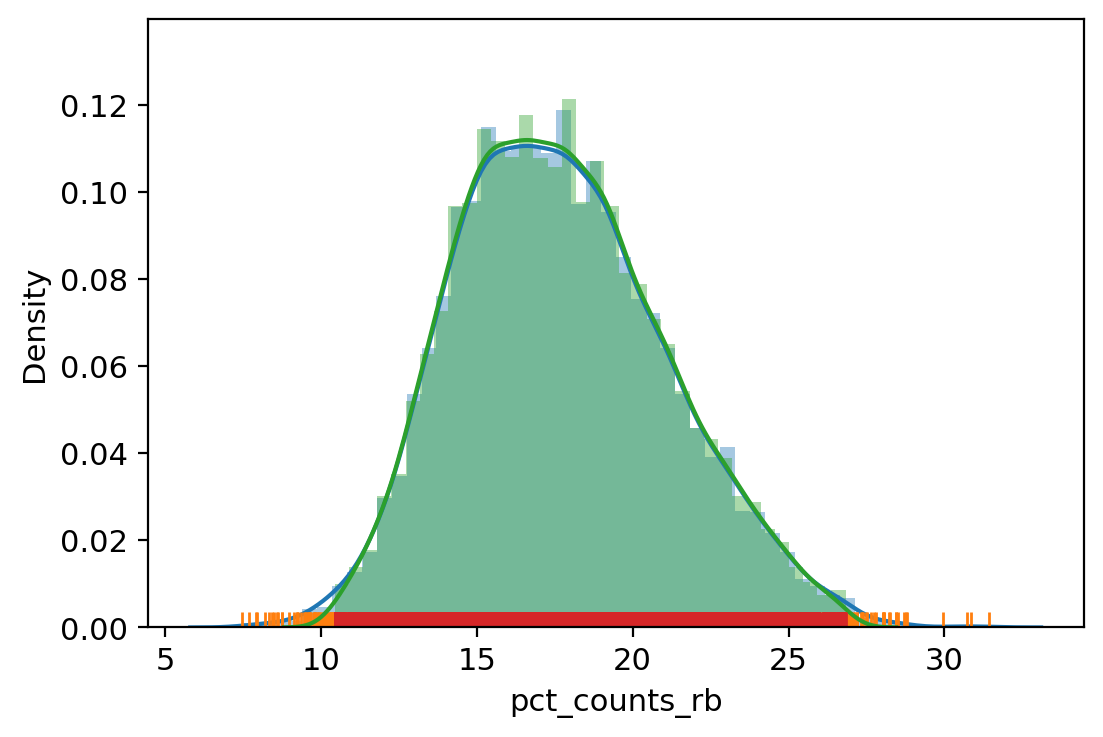
sc.pl.violin(adata_, ['n_genes_by_counts', 'total_counts', 'pct_counts_mt', 'pct_counts_rb', 'pct_counts_hla', 'pct_counts_hb', 'pct_counts_in_top_20_genes'], jitter=0.4, multi_panel=True)
[15]:
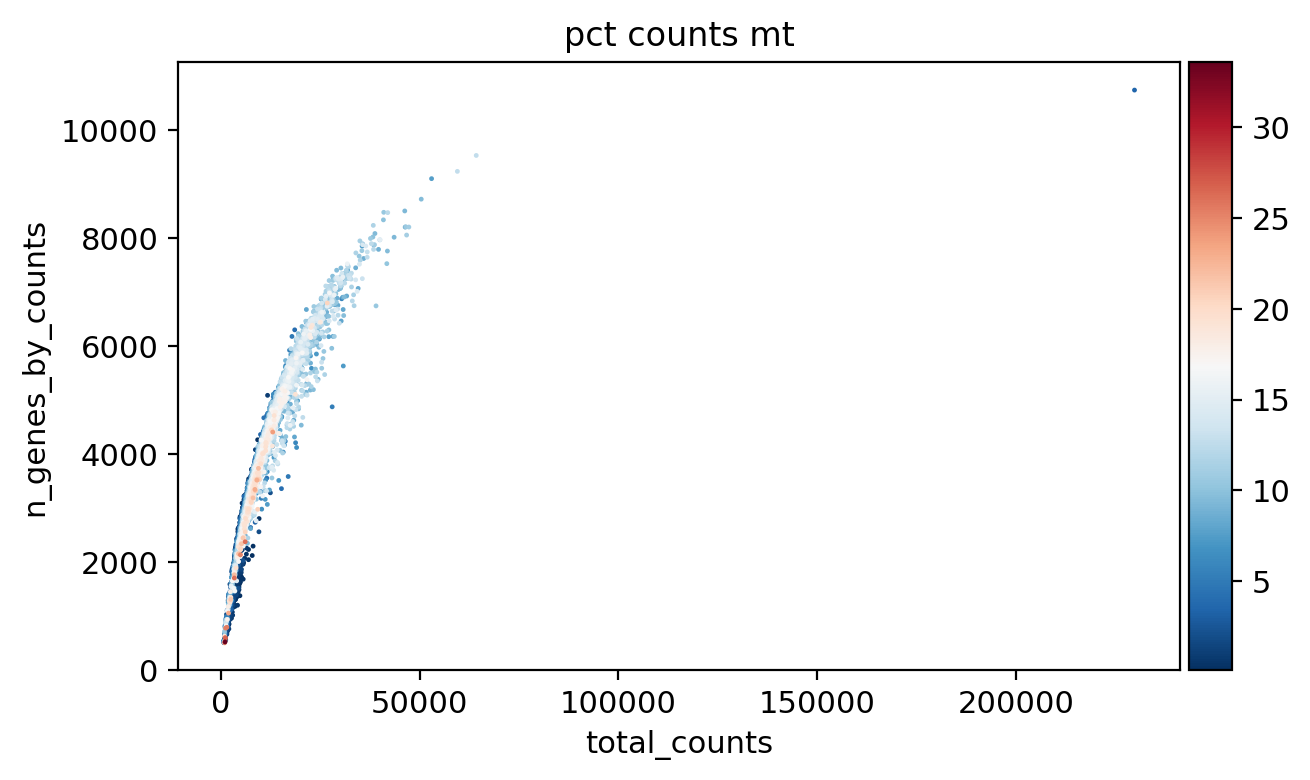
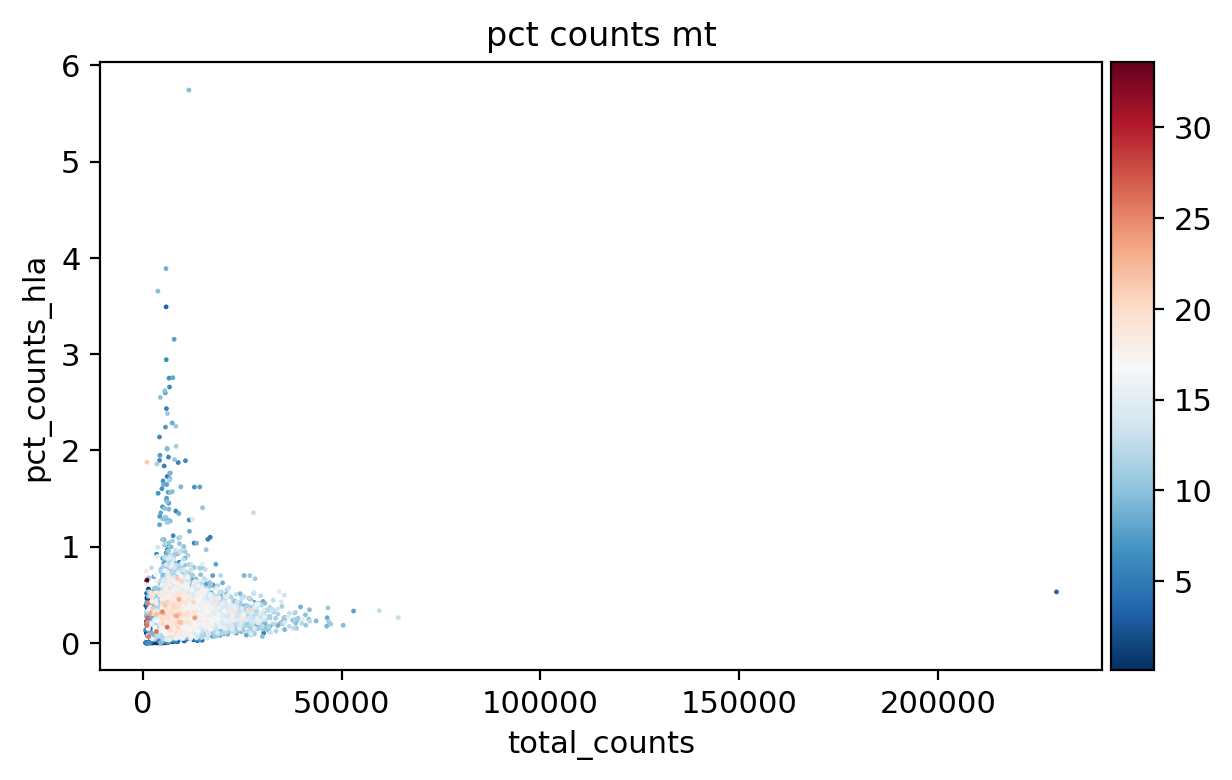
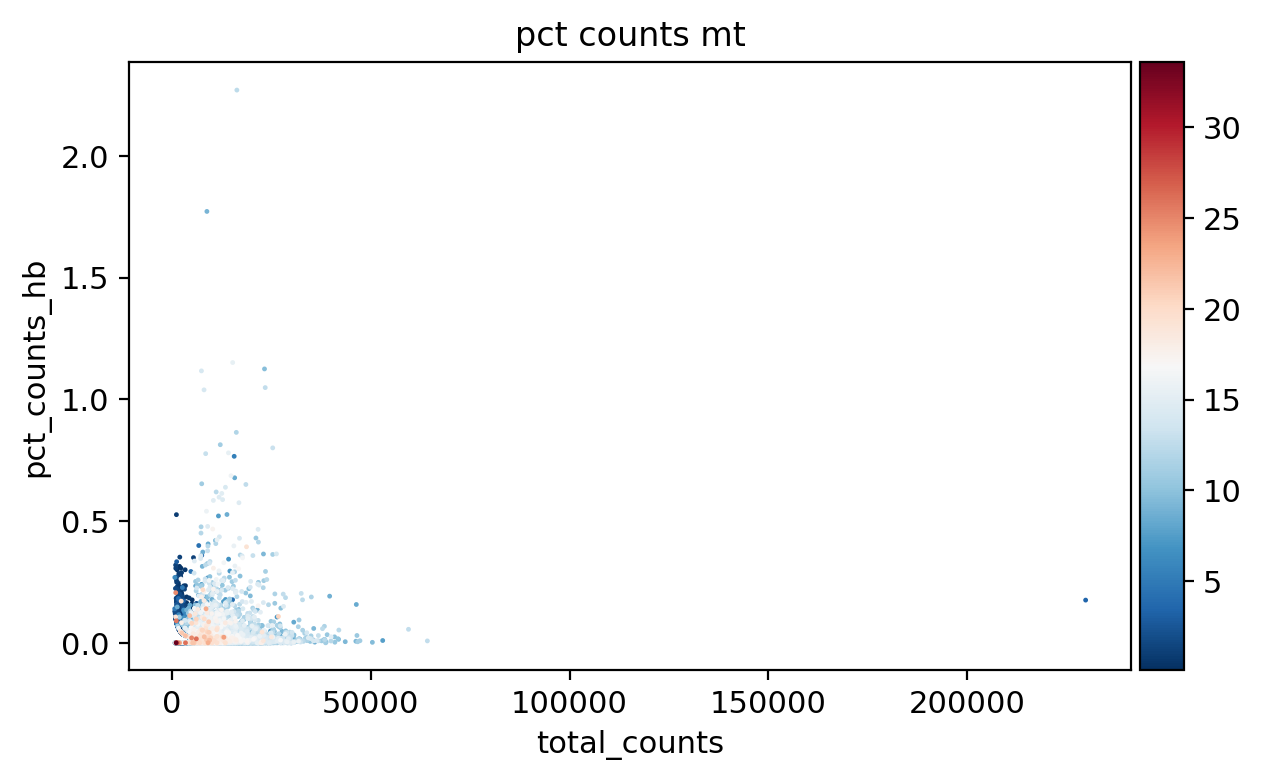
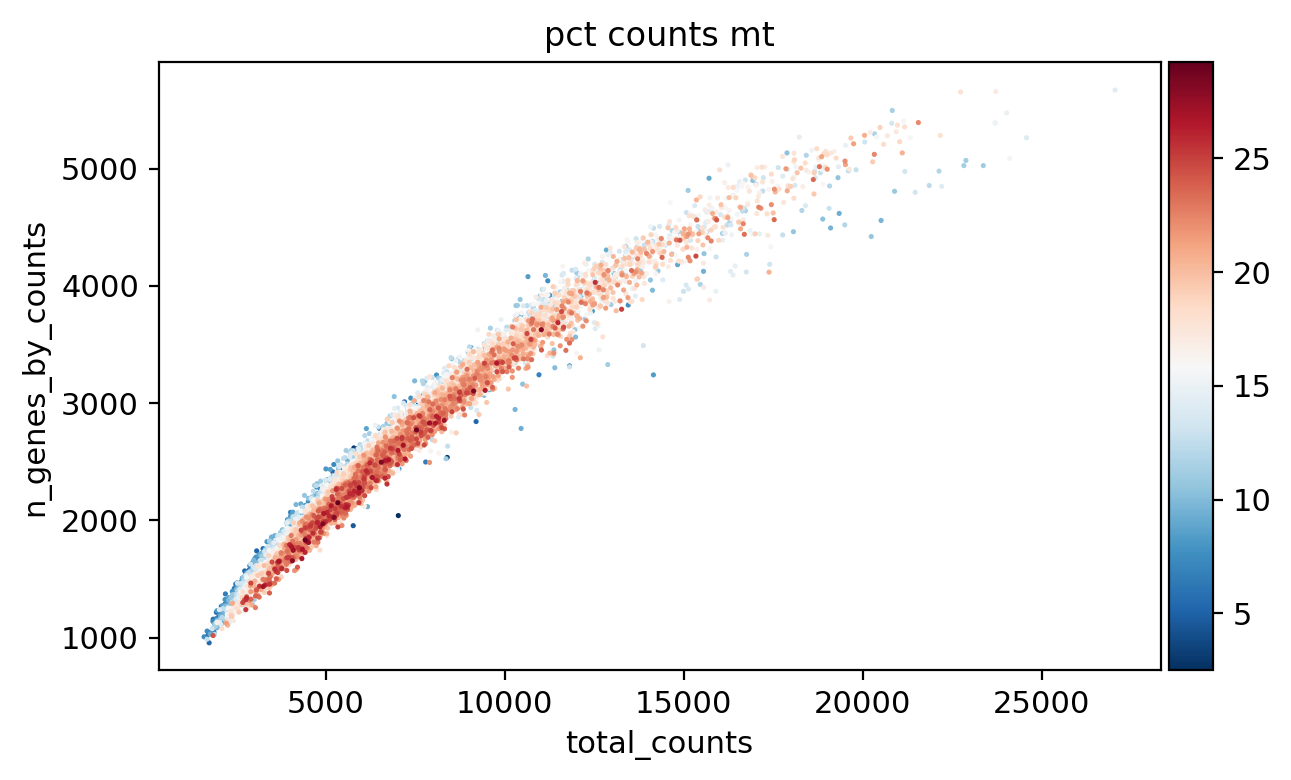
sc.pl.scatter(adata_, x='total_counts', y='n_genes_by_counts', color='pct_counts_mt')
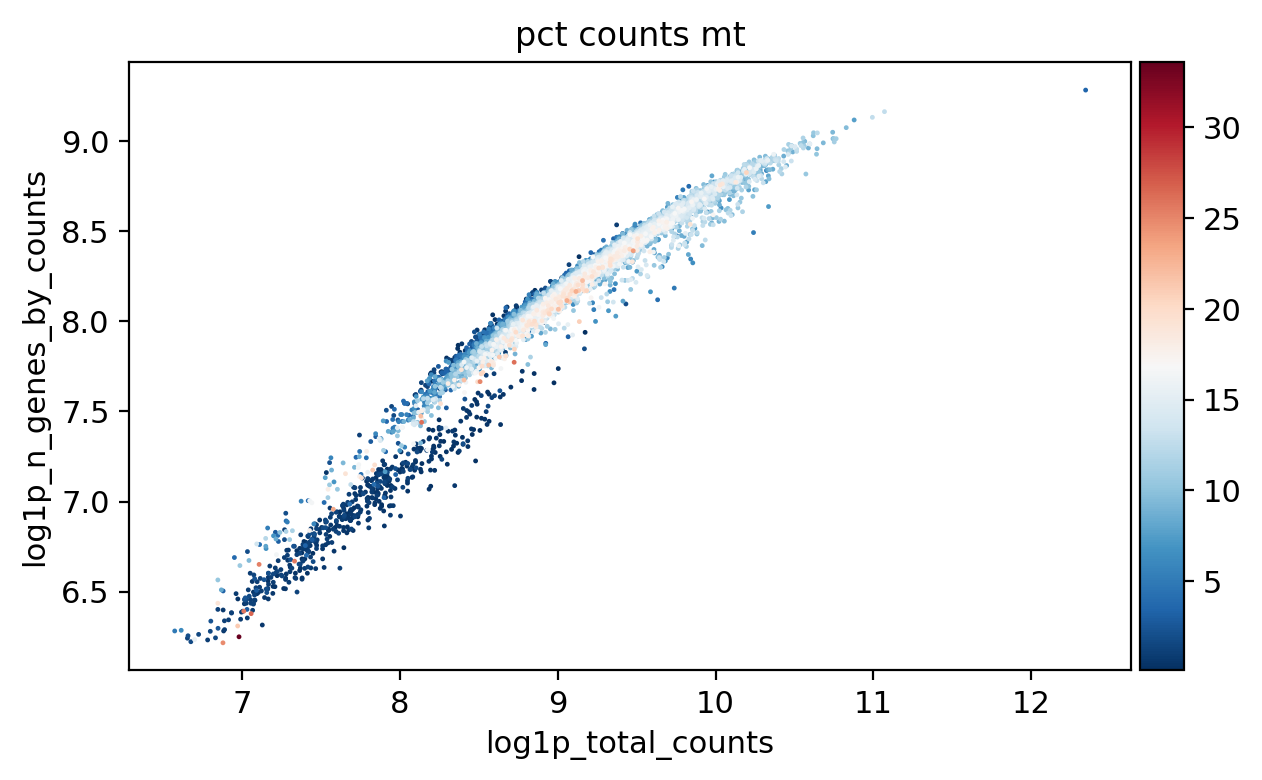
sc.pl.scatter(adata_, x='log1p_total_counts', y='log1p_n_genes_by_counts', color='pct_counts_mt')
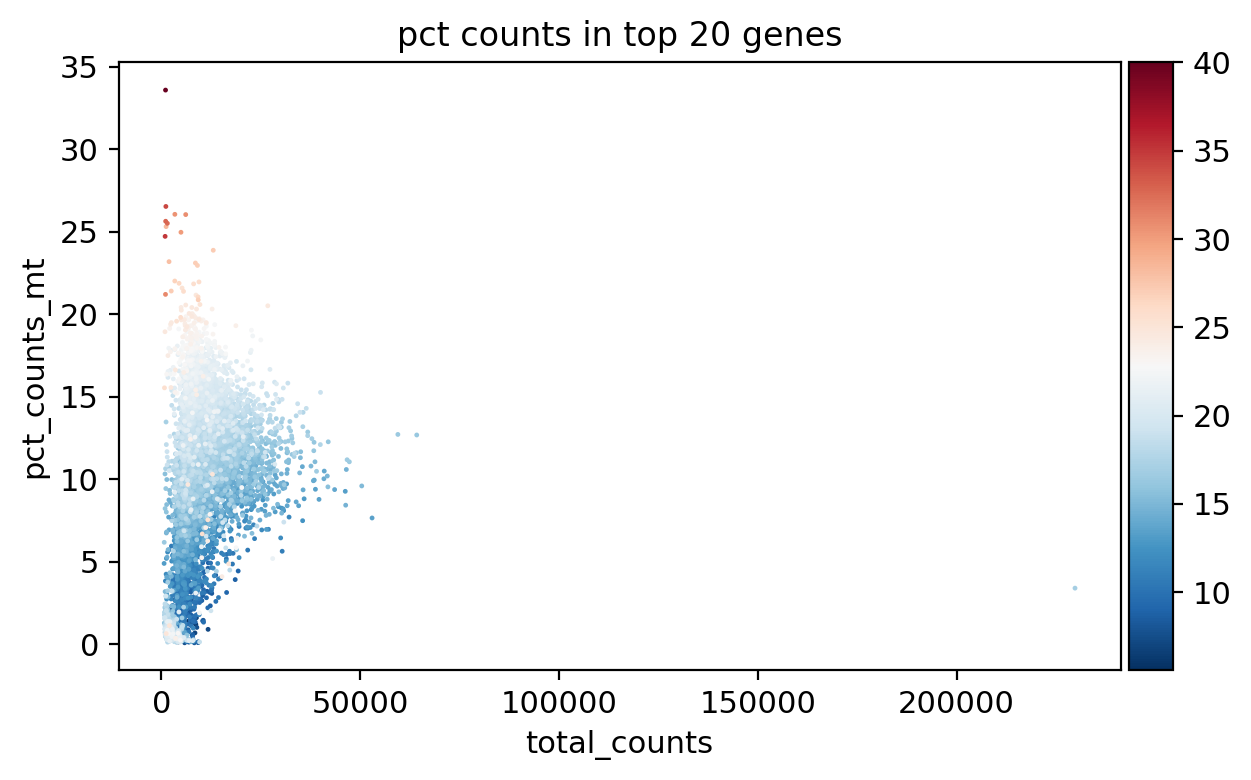
sc.pl.scatter(adata_, x='total_counts', y='pct_counts_mt', color='pct_counts_in_top_20_genes')
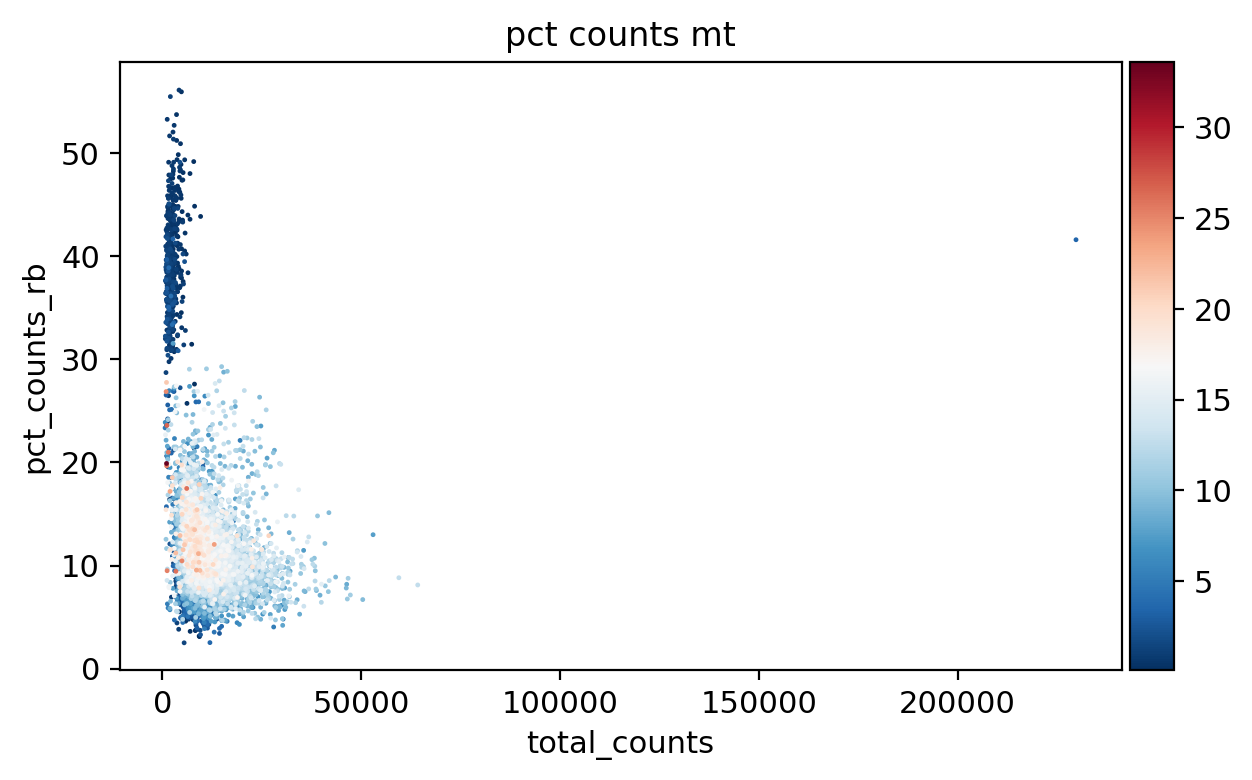
sc.pl.scatter(adata_, x='total_counts', y='pct_counts_rb', color='pct_counts_mt')
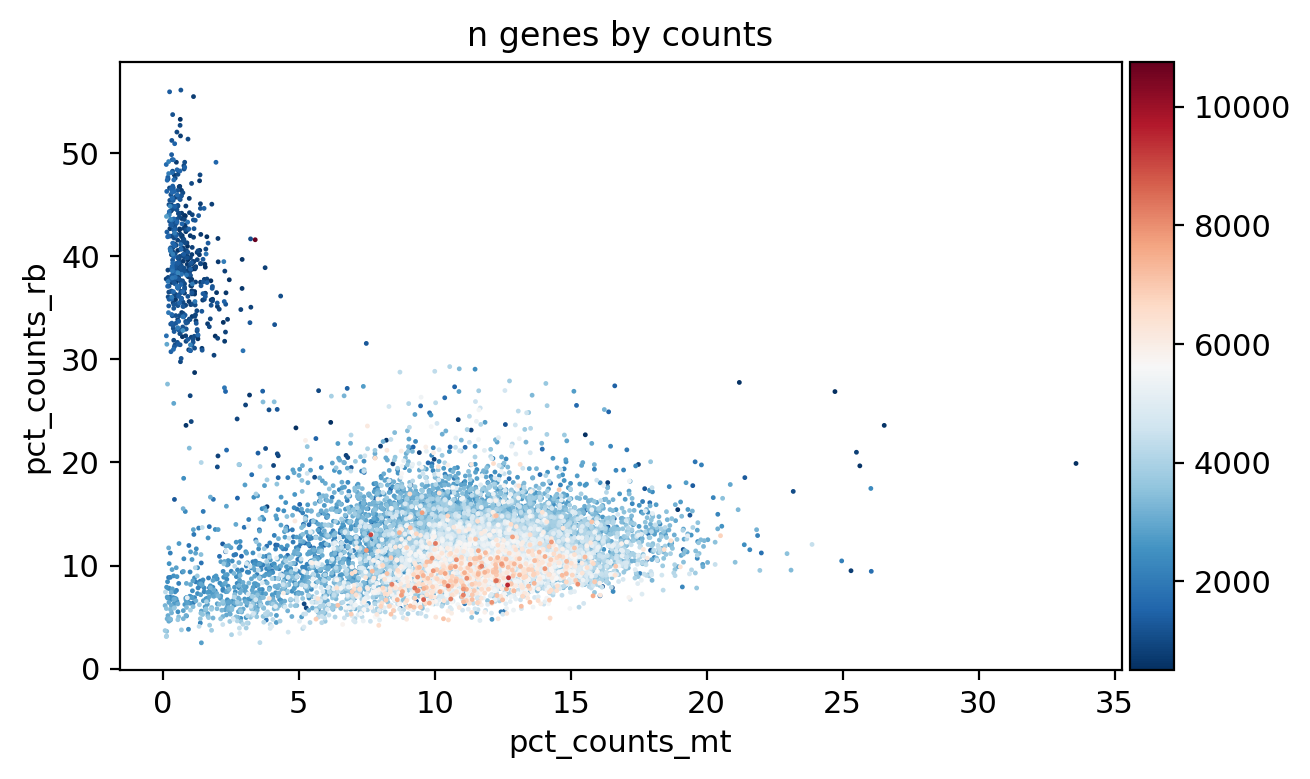
sc.pl.scatter(adata_, x='pct_counts_mt', y='pct_counts_rb', color='n_genes_by_counts')
sc.pl.scatter(adata_, x='total_counts', y='pct_counts_hla', color='pct_counts_mt')
sc.pl.scatter(adata_, x='total_counts', y='pct_counts_hb', color='pct_counts_mt')
[16]:
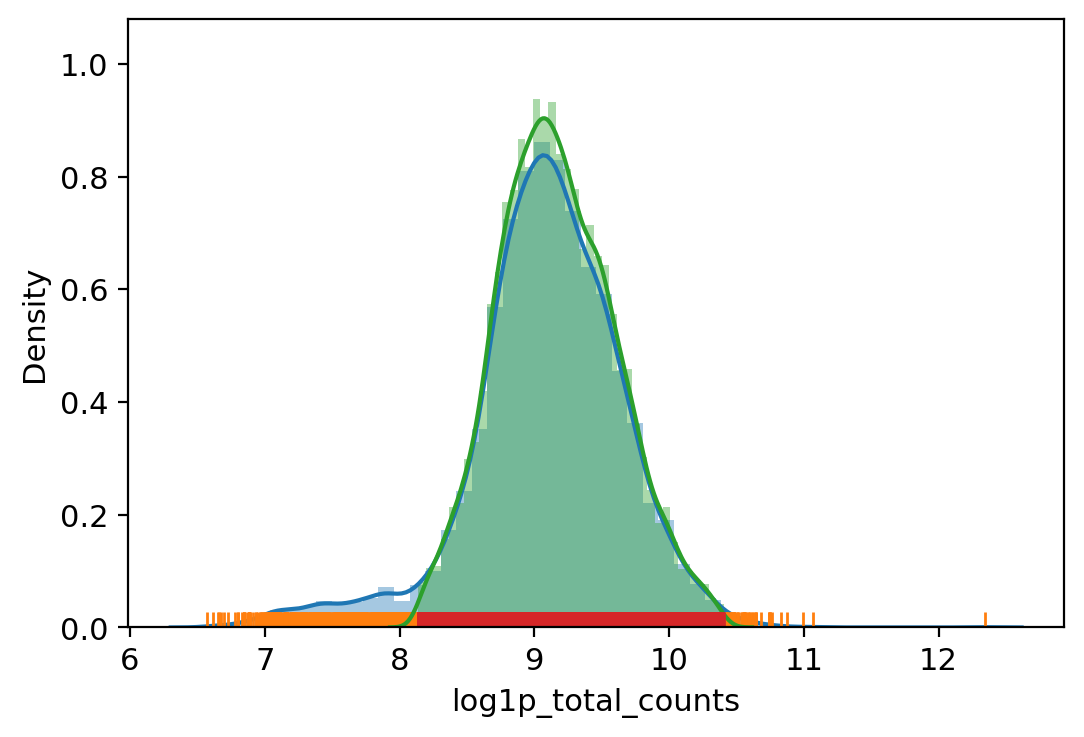
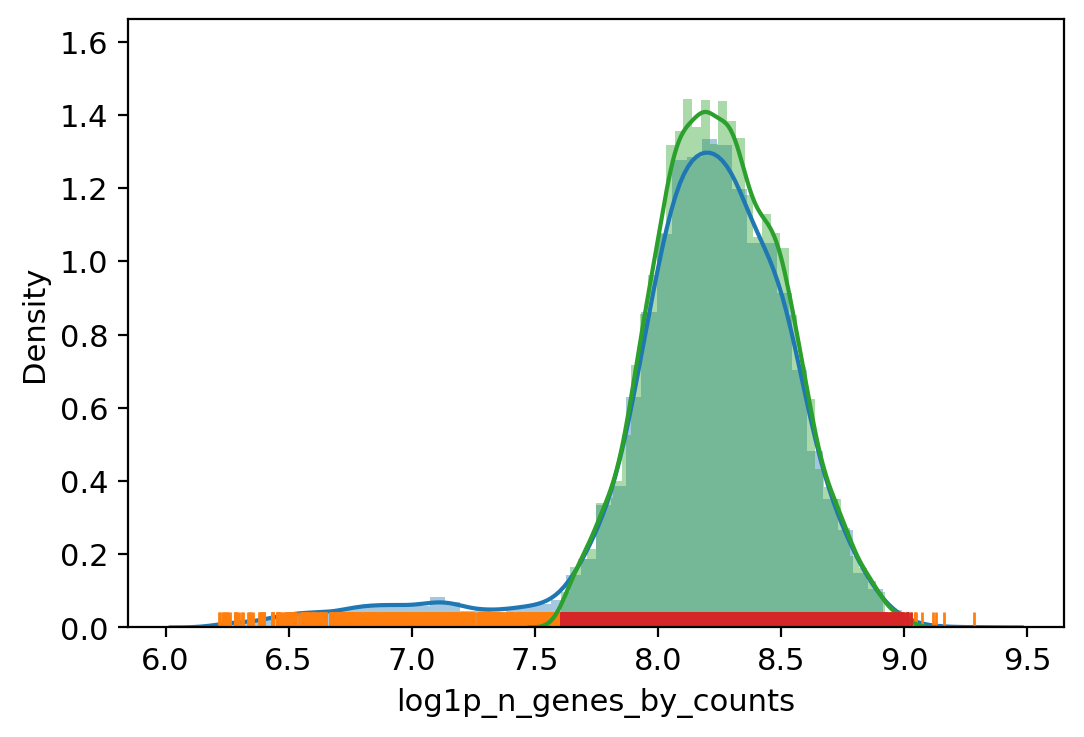
# Filter out outliers based on QC metrics with autodetected thresholds
adata_.obs["outlier"] = (
    vv.is_outlier(adata_, "log1p_total_counts", 3, 4)
    | vv.is_outlier(adata_, "log1p_n_genes_by_counts", 3, 4)
    | vv.is_outlier(adata_, "pct_counts_in_top_20_genes", 4, 4)
    | vv.is_outlier(adata_, "pct_counts_mt", 4, 3)
    | vv.is_outlier(adata_, "pct_counts_rb", 3, 4)
)
adata_.obs.outlier.value_counts()
total_counts lower_bound 3421.936767913161, upper_bound 33089.59415179074
n_genes_by_counts lower_bound 2007.9104862490526, upper_bound 8357.539854741306
pct_counts_in_top_20_genes lower_bound 9.288843340823774, upper_bound 23.440522986465083
pct_counts_mt lower_bound 1.85882568359375, upper_bound 18.090338706970215
pct_counts_rb lower_bound 5.138129234313965, upper_bound 20.41178321838379
[16]:
False    8697
True     1305
Name: outlier, dtype: int64
[17]:
adata_ = adata_[~adata_.obs.outlier].copy()
adata_
[17]:
AnnData object with n_obs × n_vars = 8697 × 22527
    obs: 'n_genes', 'n_genes_by_counts', 'log1p_n_genes_by_counts', 'total_counts', 'log1p_total_counts', 'pct_counts_in_top_20_genes', 'total_counts_mt', 'log1p_total_counts_mt', 'pct_counts_mt', 'total_counts_rb', 'log1p_total_counts_rb', 'pct_counts_rb', 'total_counts_hla', 'log1p_total_counts_hla', 'pct_counts_hla', 'total_counts_hb', 'log1p_total_counts_hb', 'pct_counts_hb', 'outlier'
    var: 'gene_ids', 'feature_types', 'n_cells', 'mt', 'rb', 'hla', 'hb', 'n_cells_by_counts', 'mean_counts', 'log1p_mean_counts', 'pct_dropout_by_counts', 'total_counts', 'log1p_total_counts'
[18]:
sc.pp.filter_genes(adata_, min_counts=20)
Filter highly-variable genes in total RNA space
[19]:
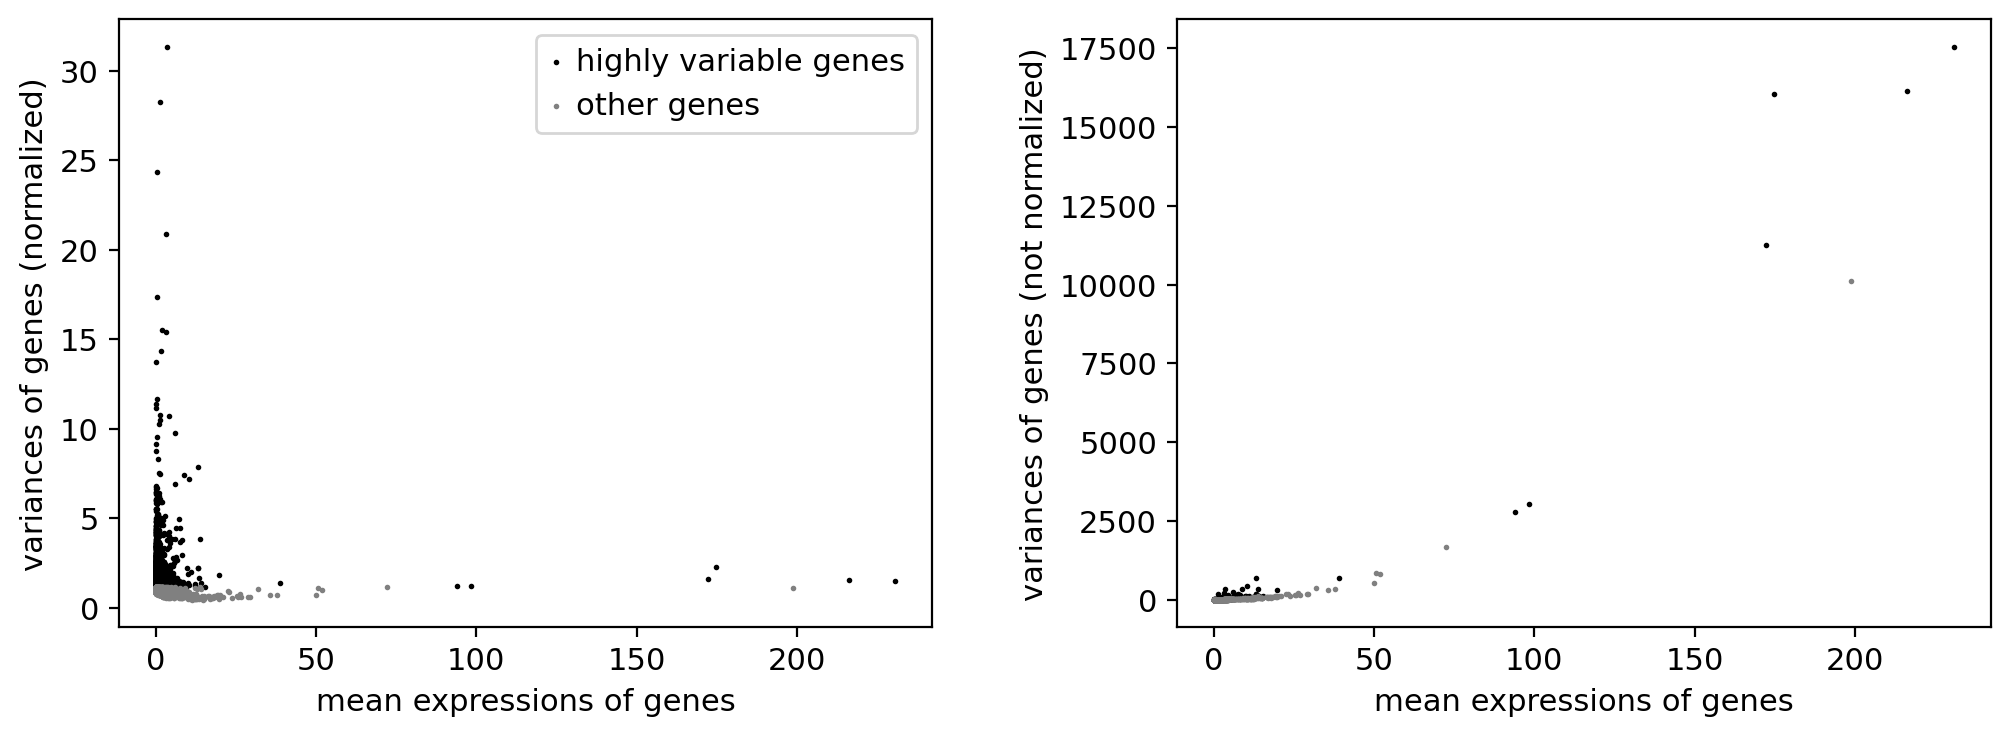
sc.pp.highly_variable_genes(adata_, n_top_genes=3000, flavor="seurat_v3")
sc.pl.highly_variable_genes(adata_)
[20]:
np.sum(adata_.var.highly_variable)
[20]:
3000
Preprocess unspliced and spliced counts from STARsolo
[21]:
adata = sc.read_10x_mtx('starsolo-filtered/', var_names='gene_symbols', make_unique=True, cache=True, gex_only=True)
adata.layers['unspliced'] = sc.read_10x_mtx('starsolo-filtered/', prefix='unspliced_', var_names='gene_symbols', make_unique=True, cache=True, gex_only=True).X
adata.layers['spliced'] = sc.read_10x_mtx('starsolo-filtered/', prefix='spliced_', var_names='gene_symbols', make_unique=True, cache=True, gex_only=True).X
adata.obs_names = [x + '-1' for x in adata.obs_names]
[22]:
shared_cells = np.intersect1d(adata.obs_names, adata_.obs_names)
adata = adata[shared_cells,:]
adata
[22]:
View of AnnData object with n_obs × n_vars = 8697 × 36601
    var: 'gene_ids', 'feature_types'
    layers: 'unspliced', 'spliced'
[23]:
adata.var['HVG'] = False
adata.var.loc[adata_.var_names[adata_.var.highly_variable], 'HVG'] = True
[24]:
sc.pp.filter_genes(adata, min_cells=10)
[25]:
plt.hist(adata.X.sum(1), bins=100);
[26]:
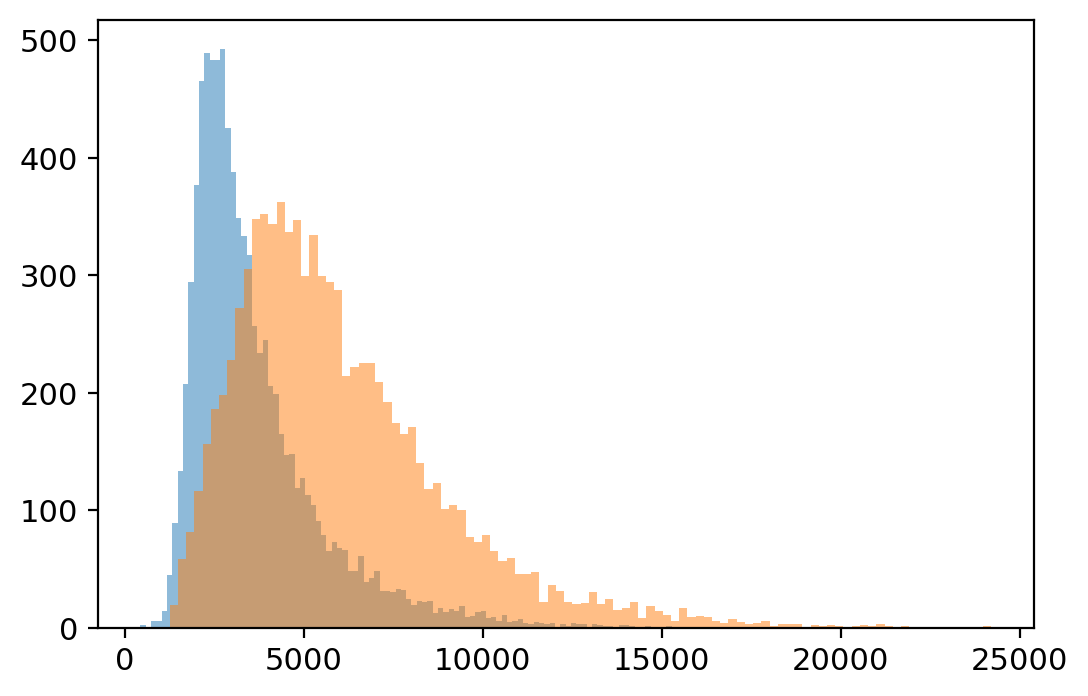
plt.hist(adata.layers['unspliced'].sum(1), bins=100, alpha=0.5);
plt.hist(adata.layers['spliced'].sum(1), bins=100, alpha=0.5);
[27]:
# Define some extra metrics
counts_u = adata.layers['unspliced'].sum(1).A1
counts_s = adata.layers['spliced'].sum(1).A1
adata.obs['total_unspliced'] = counts_u
adata.obs['total_spliced'] = counts_s
adata.obs['log1p_total_unspliced'] = np.log1p(counts_u)
adata.obs['log1p_total_spliced'] = np.log1p(counts_s)
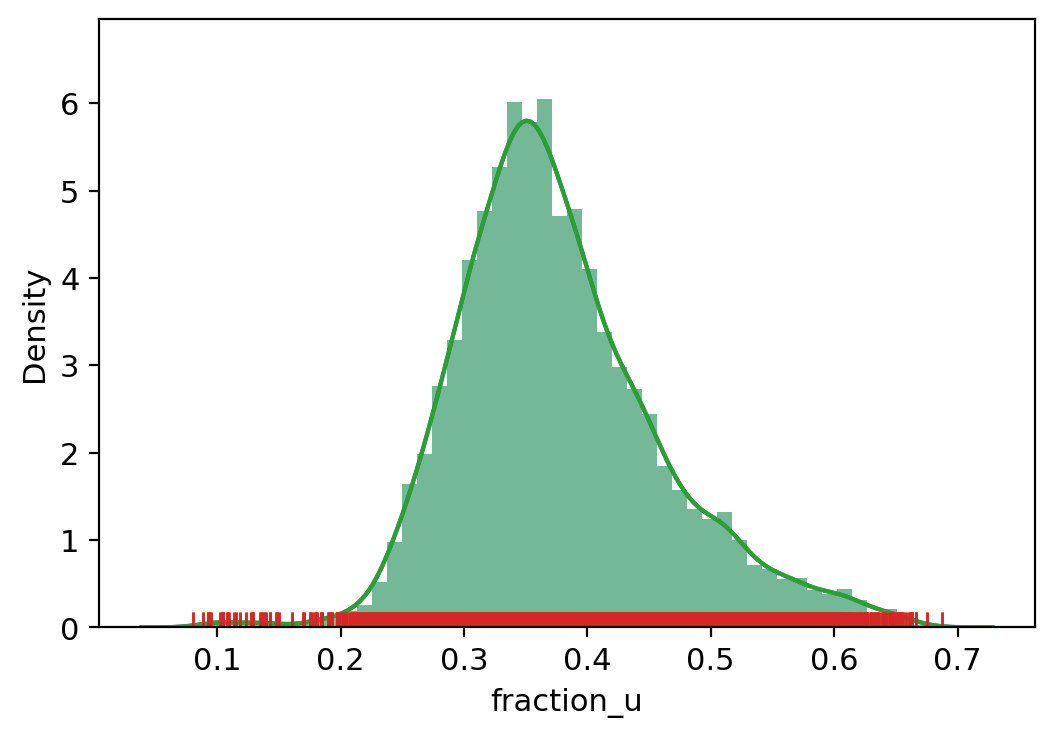
adata.obs['fraction_u'] = counts_u / (counts_s + counts_u)
[28]:
adata.var['mt'] = adata.var_names.str.startswith('MT-')
adata.var['rb'] = adata.var_names.str.startswith(('RPS', 'RPL'))
adata.var['hla'] = adata.var_names.str.startswith('HLA-')
adata.var['hb'] = np.in1d(adata.var_names, hb_genes)
sc.pp.calculate_qc_metrics(adata, qc_vars=['mt', 'rb', 'hla', 'hb'], percent_top=[20], log1p=True, inplace=True)
[29]:
sc.pl.violin(adata, ['n_genes_by_counts', 'total_counts', 'pct_counts_mt', 'pct_counts_rb', 'pct_counts_hla', 'pct_counts_hb', 'pct_counts_in_top_20_genes'], jitter=0.4, multi_panel=True)
[30]:
sc.pl.scatter(adata, x='total_counts', y='n_genes_by_counts', color='pct_counts_mt')
sc.pl.scatter(adata, x='total_counts', y='pct_counts_mt', color='pct_counts_in_top_20_genes')
sc.pl.scatter(adata, x='total_counts', y='pct_counts_rb', color='pct_counts_mt')
sc.pl.scatter(adata, x='pct_counts_mt', y='pct_counts_rb', color='n_genes_by_counts')
[31]:
# Filter out outliers based on QC metrics with autodetected thresholds
adata.obs["outlier"] = (
    vv.is_outlier(adata, "log1p_total_counts", 3, 4)
    | vv.is_outlier(adata, "log1p_total_unspliced", 4, 5)
    | vv.is_outlier(adata, "log1p_total_spliced", 4, 5)
    | vv.is_outlier(adata, "pct_counts_mt", 4, 3)
    | vv.is_outlier(adata, "pct_counts_rb", 3, 4)
)
adata.obs.outlier.value_counts()
total_counts lower_bound 2425.4803786099255, upper_bound 22132.372237304127
total_unspliced lower_bound 982.7264742937743, upper_bound 12939.346125136475
total_spliced lower_bound 1481.9934033993256, upper_bound 24207.00390625
pct_counts_mt lower_bound 6.206668853759766, upper_bound 24.5504732131958
pct_counts_rb lower_bound 10.420002937316895, upper_bound 26.875526428222656
[31]:
False    8193
True      504
Name: outlier, dtype: int64
[32]:
adata = adata[~adata.obs.outlier].copy()
adata
[32]:
AnnData object with n_obs × n_vars = 8193 × 18027
    obs: 'total_unspliced', 'total_spliced', 'log1p_total_unspliced', 'log1p_total_spliced', 'fraction_u', 'n_genes_by_counts', 'log1p_n_genes_by_counts', 'total_counts', 'log1p_total_counts', 'pct_counts_in_top_20_genes', 'total_counts_mt', 'log1p_total_counts_mt', 'pct_counts_mt', 'total_counts_rb', 'log1p_total_counts_rb', 'pct_counts_rb', 'total_counts_hla', 'log1p_total_counts_hla', 'pct_counts_hla', 'total_counts_hb', 'log1p_total_counts_hb', 'pct_counts_hb', 'outlier'
    var: 'gene_ids', 'feature_types', 'HVG', 'n_cells', 'mt', 'rb', 'hla', 'hb', 'n_cells_by_counts', 'mean_counts', 'log1p_mean_counts', 'pct_dropout_by_counts', 'total_counts', 'log1p_total_counts'
    layers: 'unspliced', 'spliced'
[33]:
scv.pp.filter_genes(adata, min_shared_counts=20)
shared_genes = np.intersect1d(adata.var_names, adata_atac_.var_names)
adata = adata[:, shared_genes]
adata
Filtered out 7804 genes that are detected 20 counts (shared).
[33]:
View of AnnData object with n_obs × n_vars = 8193 × 9844
    obs: 'total_unspliced', 'total_spliced', 'log1p_total_unspliced', 'log1p_total_spliced', 'fraction_u', 'n_genes_by_counts', 'log1p_n_genes_by_counts', 'total_counts', 'log1p_total_counts', 'pct_counts_in_top_20_genes', 'total_counts_mt', 'log1p_total_counts_mt', 'pct_counts_mt', 'total_counts_rb', 'log1p_total_counts_rb', 'pct_counts_rb', 'total_counts_hla', 'log1p_total_counts_hla', 'pct_counts_hla', 'total_counts_hb', 'log1p_total_counts_hb', 'pct_counts_hb', 'outlier', 'initial_size_unspliced', 'initial_size_spliced', 'initial_size'
    var: 'gene_ids', 'feature_types', 'HVG', 'n_cells', 'mt', 'rb', 'hla', 'hb', 'n_cells_by_counts', 'mean_counts', 'log1p_mean_counts', 'pct_dropout_by_counts', 'total_counts', 'log1p_total_counts'
    layers: 'unspliced', 'spliced'
[34]:
adata.obs["outlier"] = (
    vv.is_outlier(adata, "fraction_u")
)
adata.obs.outlier.value_counts()
fraction_u lower_bound 0.07987459003925323, upper_bound 0.6870881915092468
[34]:
False    8193
Name: outlier, dtype: int64
[35]:
shared_cells = pd.Index(np.intersect1d(adata.obs_names, adata_atac_.obs_names))
shared_genes = pd.Index(np.intersect1d(adata.var_names, adata_atac_.var_names))
shared_cells, shared_genes
[35]:
(Index(['AAACAGCCAGCCGCTA-1', 'AAACAGCCAGTAGCCT-1', 'AAACATGCAAGGTACG-1',
        'AAACATGCAATTAACC-1', 'AAACATGCAATTGAAG-1', 'AAACATGCACCTCACC-1',
        'AAACATGCAGGCTAGA-1', 'AAACCAACAAAGCTCC-1', 'AAACCAACACATGCTA-1',
        'AAACCAACAGCCGCTA-1',
        ...
        'TTTGTGAAGTTGTCAA-1', 'TTTGTGGCAAGCGAGC-1', 'TTTGTGGCAGACAAAC-1',
        'TTTGTGGCAGCAAGGC-1', 'TTTGTGGCAGGCTGTT-1', 'TTTGTGGCAGGTCCTG-1',
        'TTTGTGTTCCATCAGG-1', 'TTTGTGTTCCCGCATT-1', 'TTTGTTGGTGCATCGG-1',
        'TTTGTTGGTGTGAGAG-1'],
       dtype='object', length=6336),
 Index(['A1BG-AS1', 'AAAS', 'AACS', 'AADAT', 'AAGAB', 'AAK1', 'AAMDC', 'AAMP',
        'AARS', 'AARS2',
        ...
        'ZSWIM8', 'ZSWIM9', 'ZUP1', 'ZW10', 'ZWILCH', 'ZWINT', 'ZXDC', 'ZYG11B',
        'ZYX', 'ZZEF1'],
       dtype='object', length=9844))
[ ]:
adata = adata[shared_cells, shared_genes].copy()
adata_atac = adata_atac_[shared_cells, shared_genes].copy()
Save preprocessed AnnData before normalization
[37]:
adata.write_h5ad('8489-MV-1_adata_prepro.h5ad')
adata_atac.write_h5ad('8489-MV-1_adata_atac_prepro.h5ad')
[38]:
adata = sc.read_h5ad('8489-MV-1_adata_prepro.h5ad')
adata_atac = sc.read_h5ad('8489-MV-1_adata_atac_prepro.h5ad')
[39]:
adata
[39]:
AnnData object with n_obs × n_vars = 6336 × 9844
    obs: 'total_unspliced', 'total_spliced', 'log1p_total_unspliced', 'log1p_total_spliced', 'fraction_u', 'n_genes_by_counts', 'log1p_n_genes_by_counts', 'total_counts', 'log1p_total_counts', 'pct_counts_in_top_20_genes', 'total_counts_mt', 'log1p_total_counts_mt', 'pct_counts_mt', 'total_counts_rb', 'log1p_total_counts_rb', 'pct_counts_rb', 'total_counts_hla', 'log1p_total_counts_hla', 'pct_counts_hla', 'total_counts_hb', 'log1p_total_counts_hb', 'pct_counts_hb', 'outlier', 'initial_size_unspliced', 'initial_size_spliced', 'initial_size'
    var: 'gene_ids', 'feature_types', 'HVG', 'n_cells', 'mt', 'rb', 'hla', 'hb', 'n_cells_by_counts', 'mean_counts', 'log1p_mean_counts', 'pct_dropout_by_counts', 'total_counts', 'log1p_total_counts'
    layers: 'spliced', 'unspliced'
Normalize ATAC and RNA counts
[40]:
vv.model.tfidf_norm(adata_atac)
[41]:
scv.pp.normalize_per_cell(adata)
Normalized count data: X, spliced, unspliced.
Compute cell cycle scores
[42]:
s_genes_list_sub = s_genes_list[np.isin(s_genes_list, adata.var_names)]
g2m_genes_list_sub = g2m_genes_list[np.isin(g2m_genes_list, adata.var_names)]
scv.tl.score_genes_cell_cycle(adata, s_genes=s_genes_list_sub, g2m_genes=g2m_genes_list_sub)
calculating cell cycle phase
-->     'S_score' and 'G2M_score', scores of cell cycle phases (adata.obs)
Check genes influenced by cell cycle
[43]:
adata_copy = adata.copy()
[44]:
# Regress out cell cycle effect in a copy and add intercept back
vv.regress_out(adata_copy, ['S_score', 'G2M_score'], add_intercept=True)
[45]:
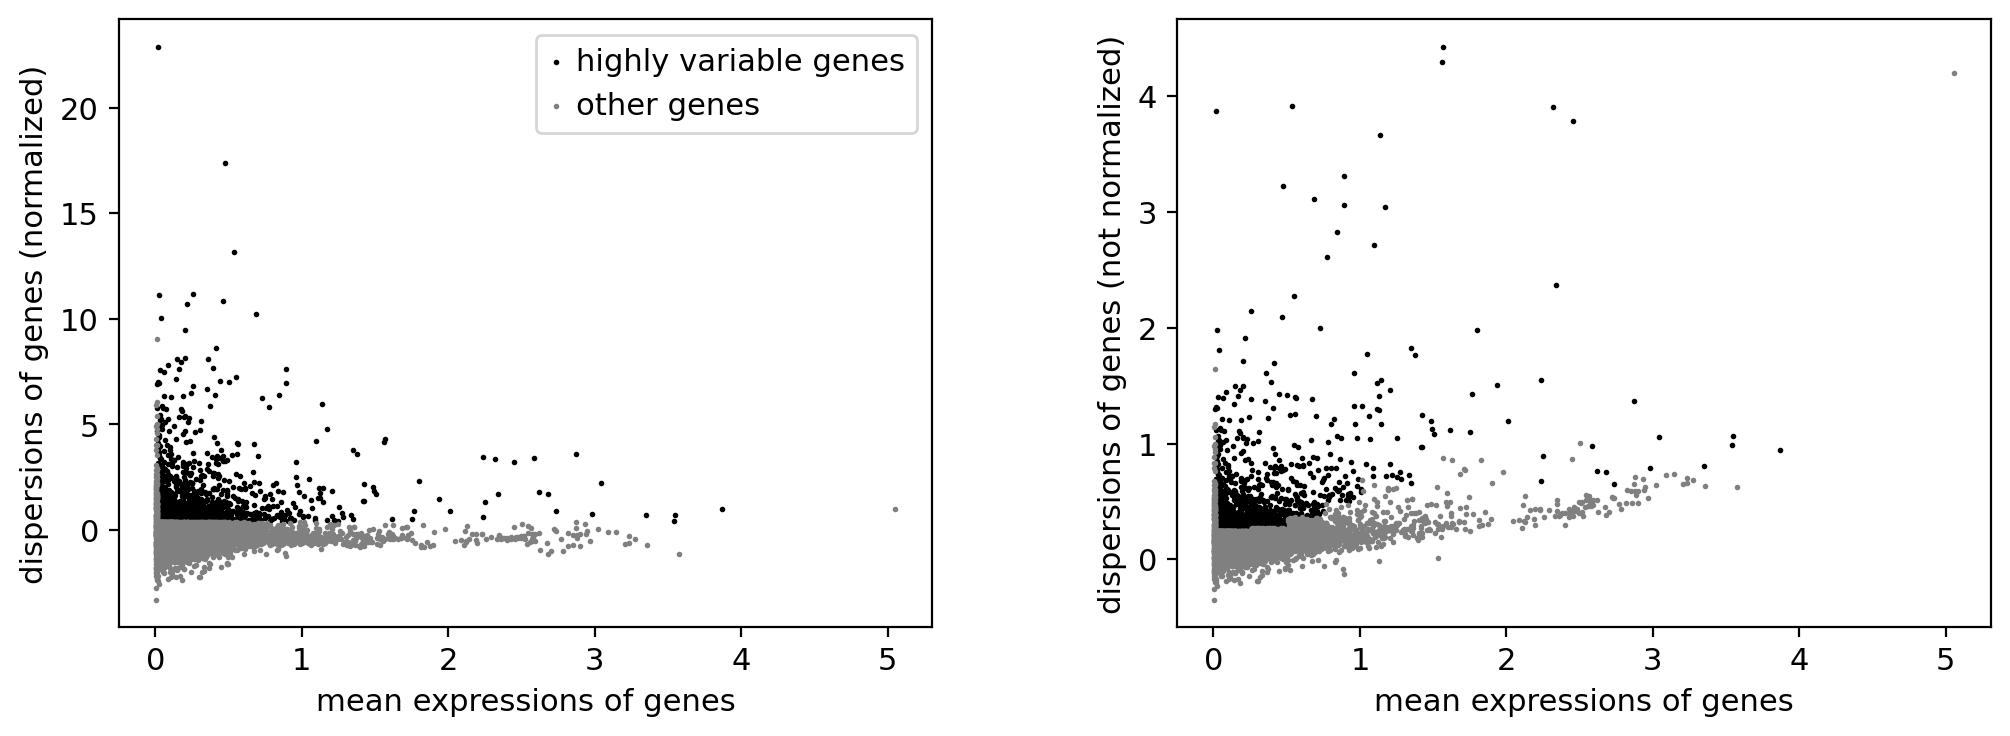
# Select genes in a copy based on dispersions after regressing out cell cycle
vv.filter_genes_dispersion(adata_copy, min_mean=0.0125, max_mean=4, min_disp=0.4, subset=False)
sc.pl.highly_variable_genes(adata_copy)
Extracted 1772 highly variable genes.
[46]:
if 'PROM1' in adata_copy.var_names:
    print(adata_copy[:, 'PROM1'].var)
              gene_ids    feature_types   HVG  n_cells     mt     rb    hla  \
PROM1  ENSG00000007062  Gene Expression  True     2496  False  False  False

          hb  n_cells_by_counts  mean_counts  log1p_mean_counts  \
PROM1  False               2496     0.430493           0.358019

       pct_dropout_by_counts  total_counts  log1p_total_counts  \
PROM1              71.300448        3744.0            8.228177

       gene_count_corr    means  dispersions  dispersions_norm  \
PROM1          -0.1283  0.34751     0.495241          1.700807

       highly_variable
PROM1             True
[47]:
np.sum(adata_copy.var.highly_variable), np.sum(adata_copy.var.HVG), np.sum(adata_copy.var.highly_variable & adata_copy.var.HVG)
[47]:
(1772, 1601, 816)
[48]:
sc.pp.log1p(adata)
[49]:
# Compute cell cycle phase difference
scv.tl.score_genes_cell_cycle(adata, s_genes=s_genes_list_sub, g2m_genes=g2m_genes_list_sub)
adata.obs['CC_difference'] = adata.obs['S_score'] - adata.obs['G2M_score']
len(s_genes_list_sub), len(g2m_genes_list_sub)
calculating cell cycle phase
-->     'S_score' and 'G2M_score', scores of cell cycle phases (adata.obs)
[49]:
(42, 52)
[50]:
# Recompute some extra metrics
counts_u = adata.layers['unspliced'].sum(1).A1
counts_s = adata.layers['spliced'].sum(1).A1
adata.obs['total_unspliced'] = counts_u
adata.obs['total_spliced'] = counts_s
adata.obs['log1p_total_unspliced'] = np.log1p(counts_u)
adata.obs['log1p_total_spliced'] = np.log1p(counts_s)
adata.obs['fraction_u'] = counts_u / (counts_s + counts_u)
[51]:
adata = adata[:, adata_copy.var.highly_variable & adata_copy.var.HVG]
adata.var['highly_variable'] = True
[52]:
adata_atac = adata_atac[adata.obs_names, adata.var_names]
[53]:
adata
[53]:
AnnData object with n_obs × n_vars = 6336 × 816
    obs: 'total_unspliced', 'total_spliced', 'log1p_total_unspliced', 'log1p_total_spliced', 'fraction_u', 'n_genes_by_counts', 'log1p_n_genes_by_counts', 'total_counts', 'log1p_total_counts', 'pct_counts_in_top_20_genes', 'total_counts_mt', 'log1p_total_counts_mt', 'pct_counts_mt', 'total_counts_rb', 'log1p_total_counts_rb', 'pct_counts_rb', 'total_counts_hla', 'log1p_total_counts_hla', 'pct_counts_hla', 'total_counts_hb', 'log1p_total_counts_hb', 'pct_counts_hb', 'outlier', 'initial_size_unspliced', 'initial_size_spliced', 'initial_size', 'n_counts', 'S_score', 'G2M_score', 'phase', 'CC_difference'
    var: 'gene_ids', 'feature_types', 'HVG', 'n_cells', 'mt', 'rb', 'hla', 'hb', 'n_cells_by_counts', 'mean_counts', 'log1p_mean_counts', 'pct_dropout_by_counts', 'total_counts', 'log1p_total_counts', 'gene_count_corr', 'highly_variable'
    uns: 'log1p'
    layers: 'spliced', 'unspliced'
[54]:
# Recompute some extra metrics
counts_u = adata.layers['unspliced'].sum(1).A1
counts_s = adata.layers['spliced'].sum(1).A1
adata.obs['total_unspliced2'] = counts_u
adata.obs['total_spliced2'] = counts_s
adata.obs['log1p_total_unspliced2'] = np.log1p(counts_u)
adata.obs['log1p_total_spliced2'] = np.log1p(counts_s)
adata.obs['fraction_u2'] = counts_u / (counts_s + counts_u)
[55]:
# Regress out cell cycle difference from original adata
sc.pp.regress_out(adata, ['CC_difference'])
[56]:
sc.pp.scale(adata)
[57]:
scv.pp.moments(adata, n_pcs=30, n_neighbors=50)
computing neighbors
    finished (0:00:02) --> added
    'distances' and 'connectivities', weighted adjacency matrices (adata.obsp)
computing moments based on connectivities
    finished (0:00:00) --> added
    'Ms' and 'Mu', moments of un/spliced abundances (adata.layers)
[58]:
scv.tl.umap(adata)
[59]:
adata.obs['n_c'] = adata_atac.X.sum(1)
adata.obs['n_Mu'] = np.sum(adata.layers['Mu'], 1)
adata.obs['n_Ms'] = np.sum(adata.layers['Ms'], 1)
Visualize QC metrics on UMAP
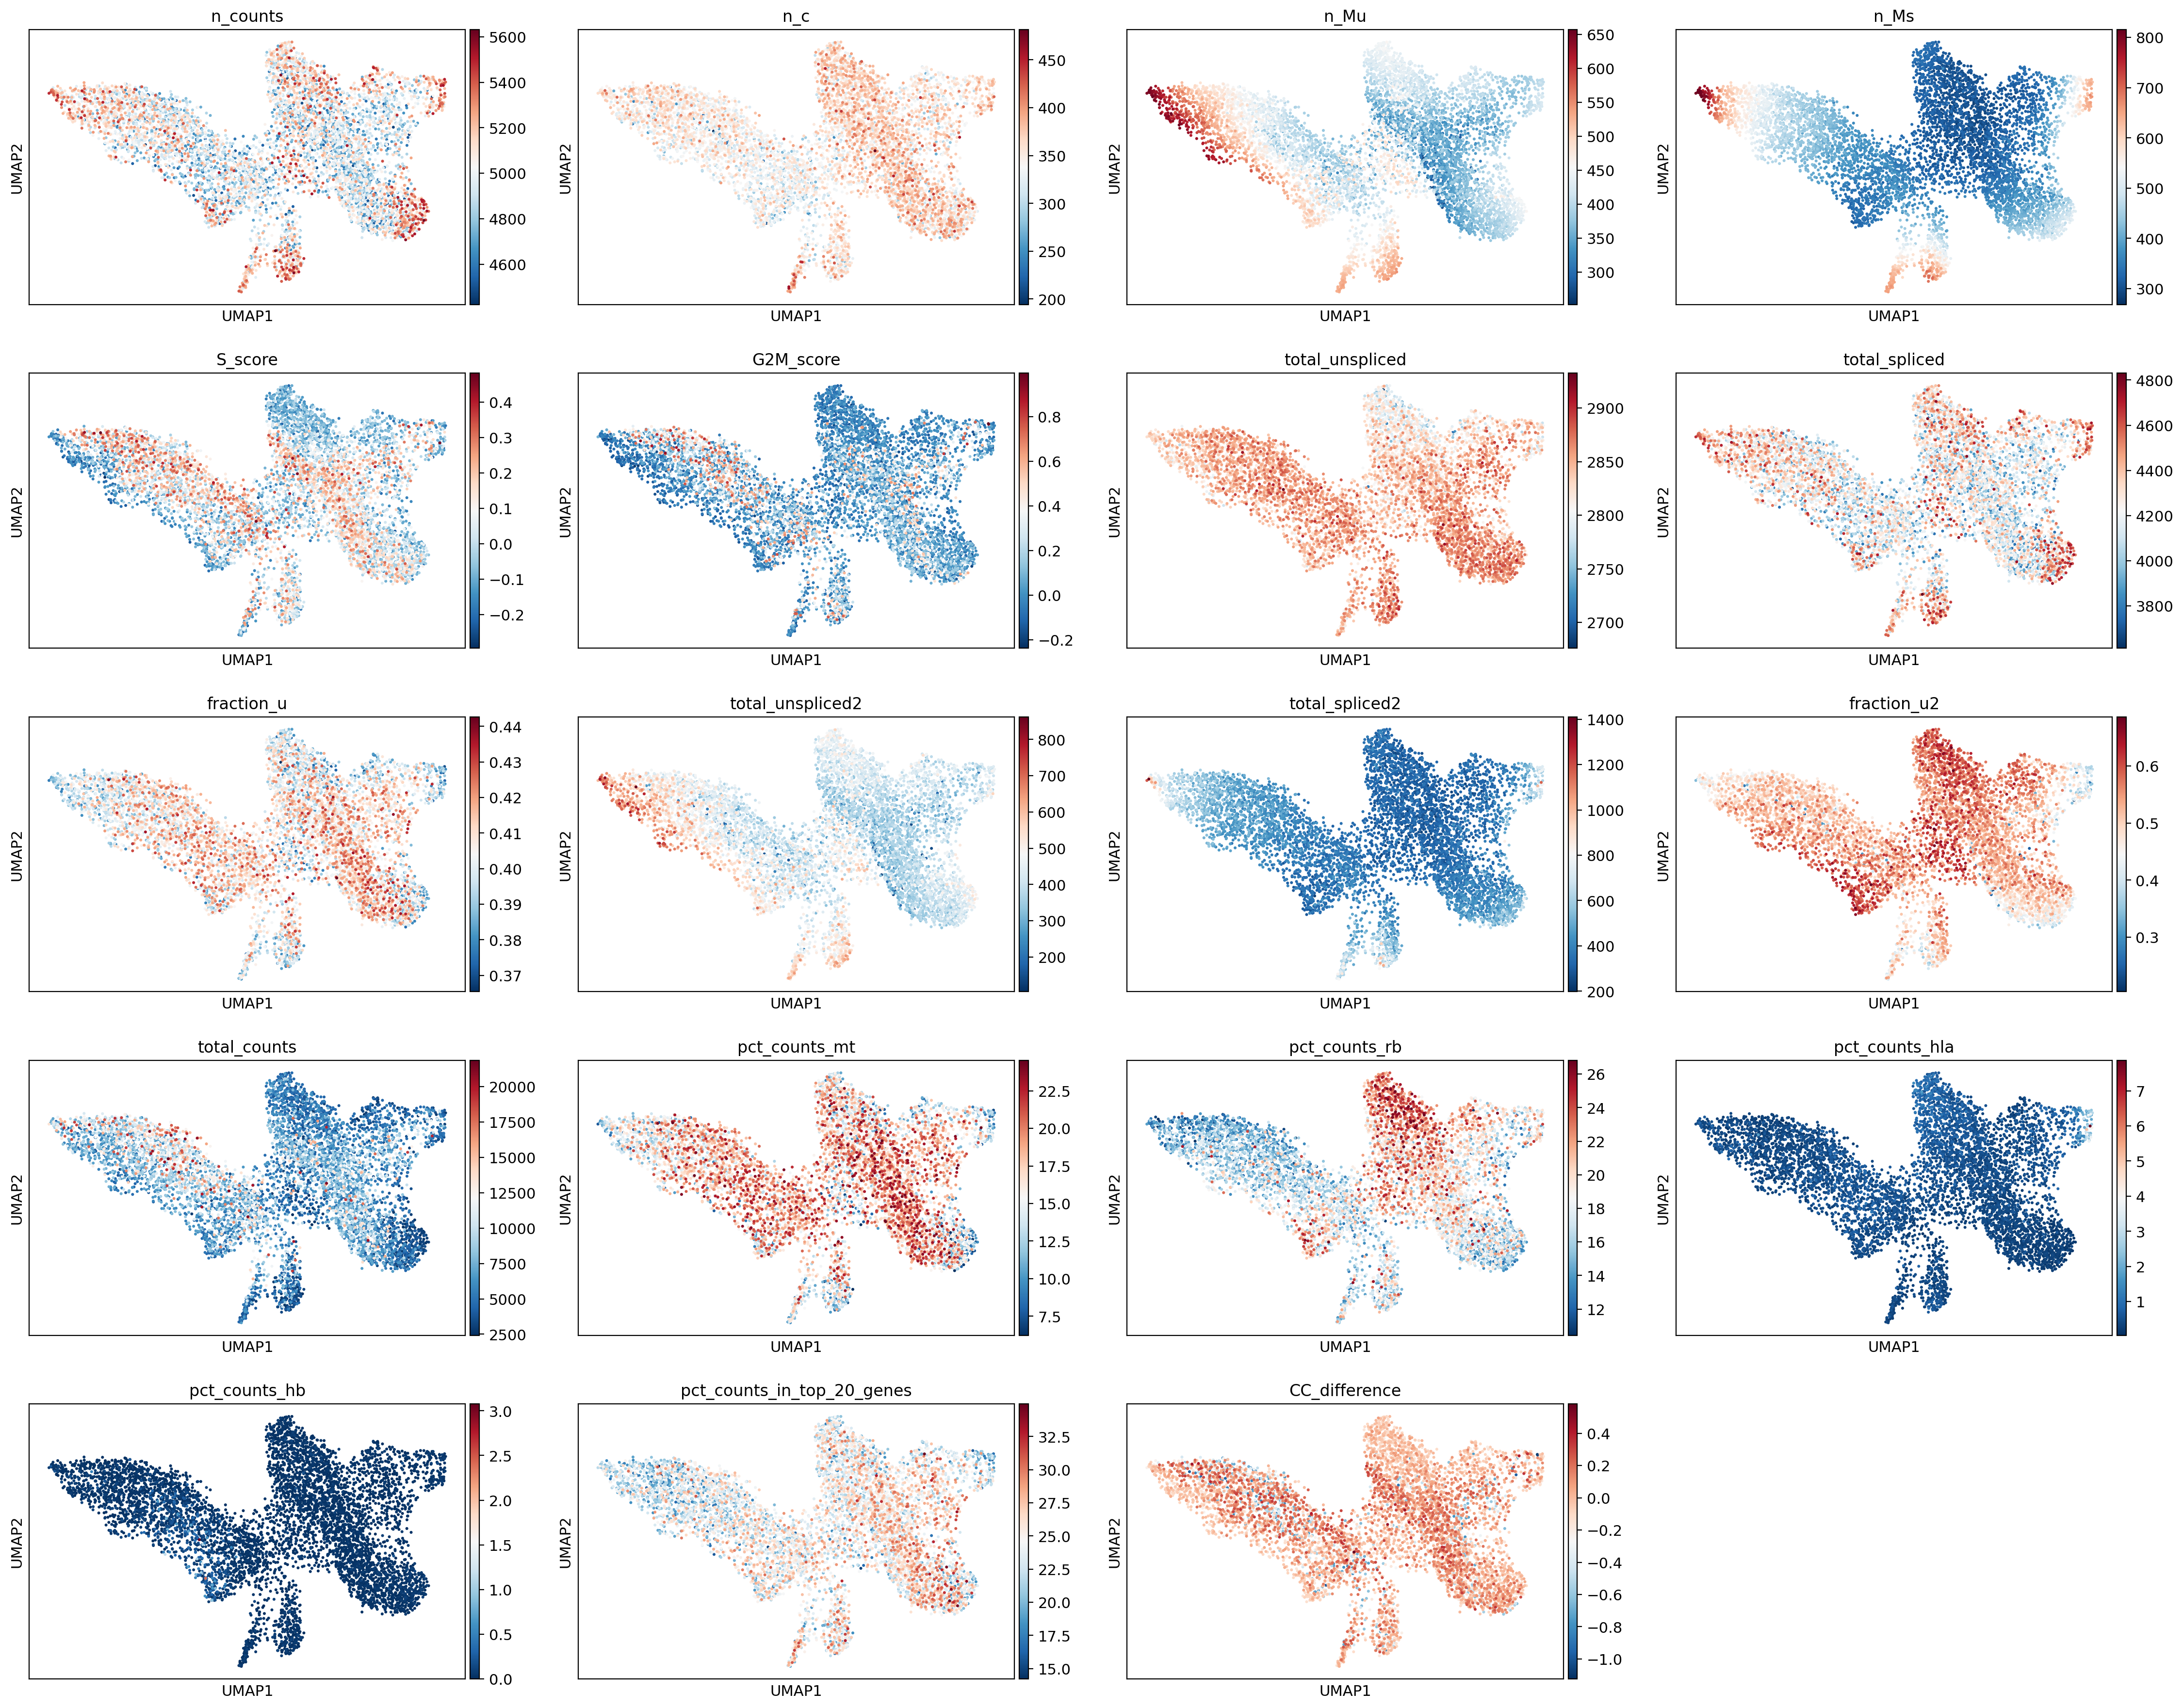
[60]:
sc.pl.umap(adata, color=['n_counts', 'n_c', 'n_Mu', 'n_Ms',
                         'S_score', 'G2M_score', 'total_unspliced', 'total_spliced',
                         'fraction_u', 'total_unspliced2', 'total_spliced2', 'fraction_u2',
                         'total_counts', 'pct_counts_mt', 'pct_counts_rb', 'pct_counts_hla',
                         'pct_counts_hb', 'pct_counts_in_top_20_genes', 'CC_difference'])
/home/chen/.mambaforge/lib/python3.10/site-packages/scanpy/plotting/_tools/scatterplots.py:163: MatplotlibDeprecationWarning: The get_cmap function was deprecated in Matplotlib 3.7 and will be removed two minor releases later. Use ``matplotlib.colormaps[name]`` or ``matplotlib.colormaps.get_cmap(obj)`` instead.
  cmap = copy(get_cmap(cmap))
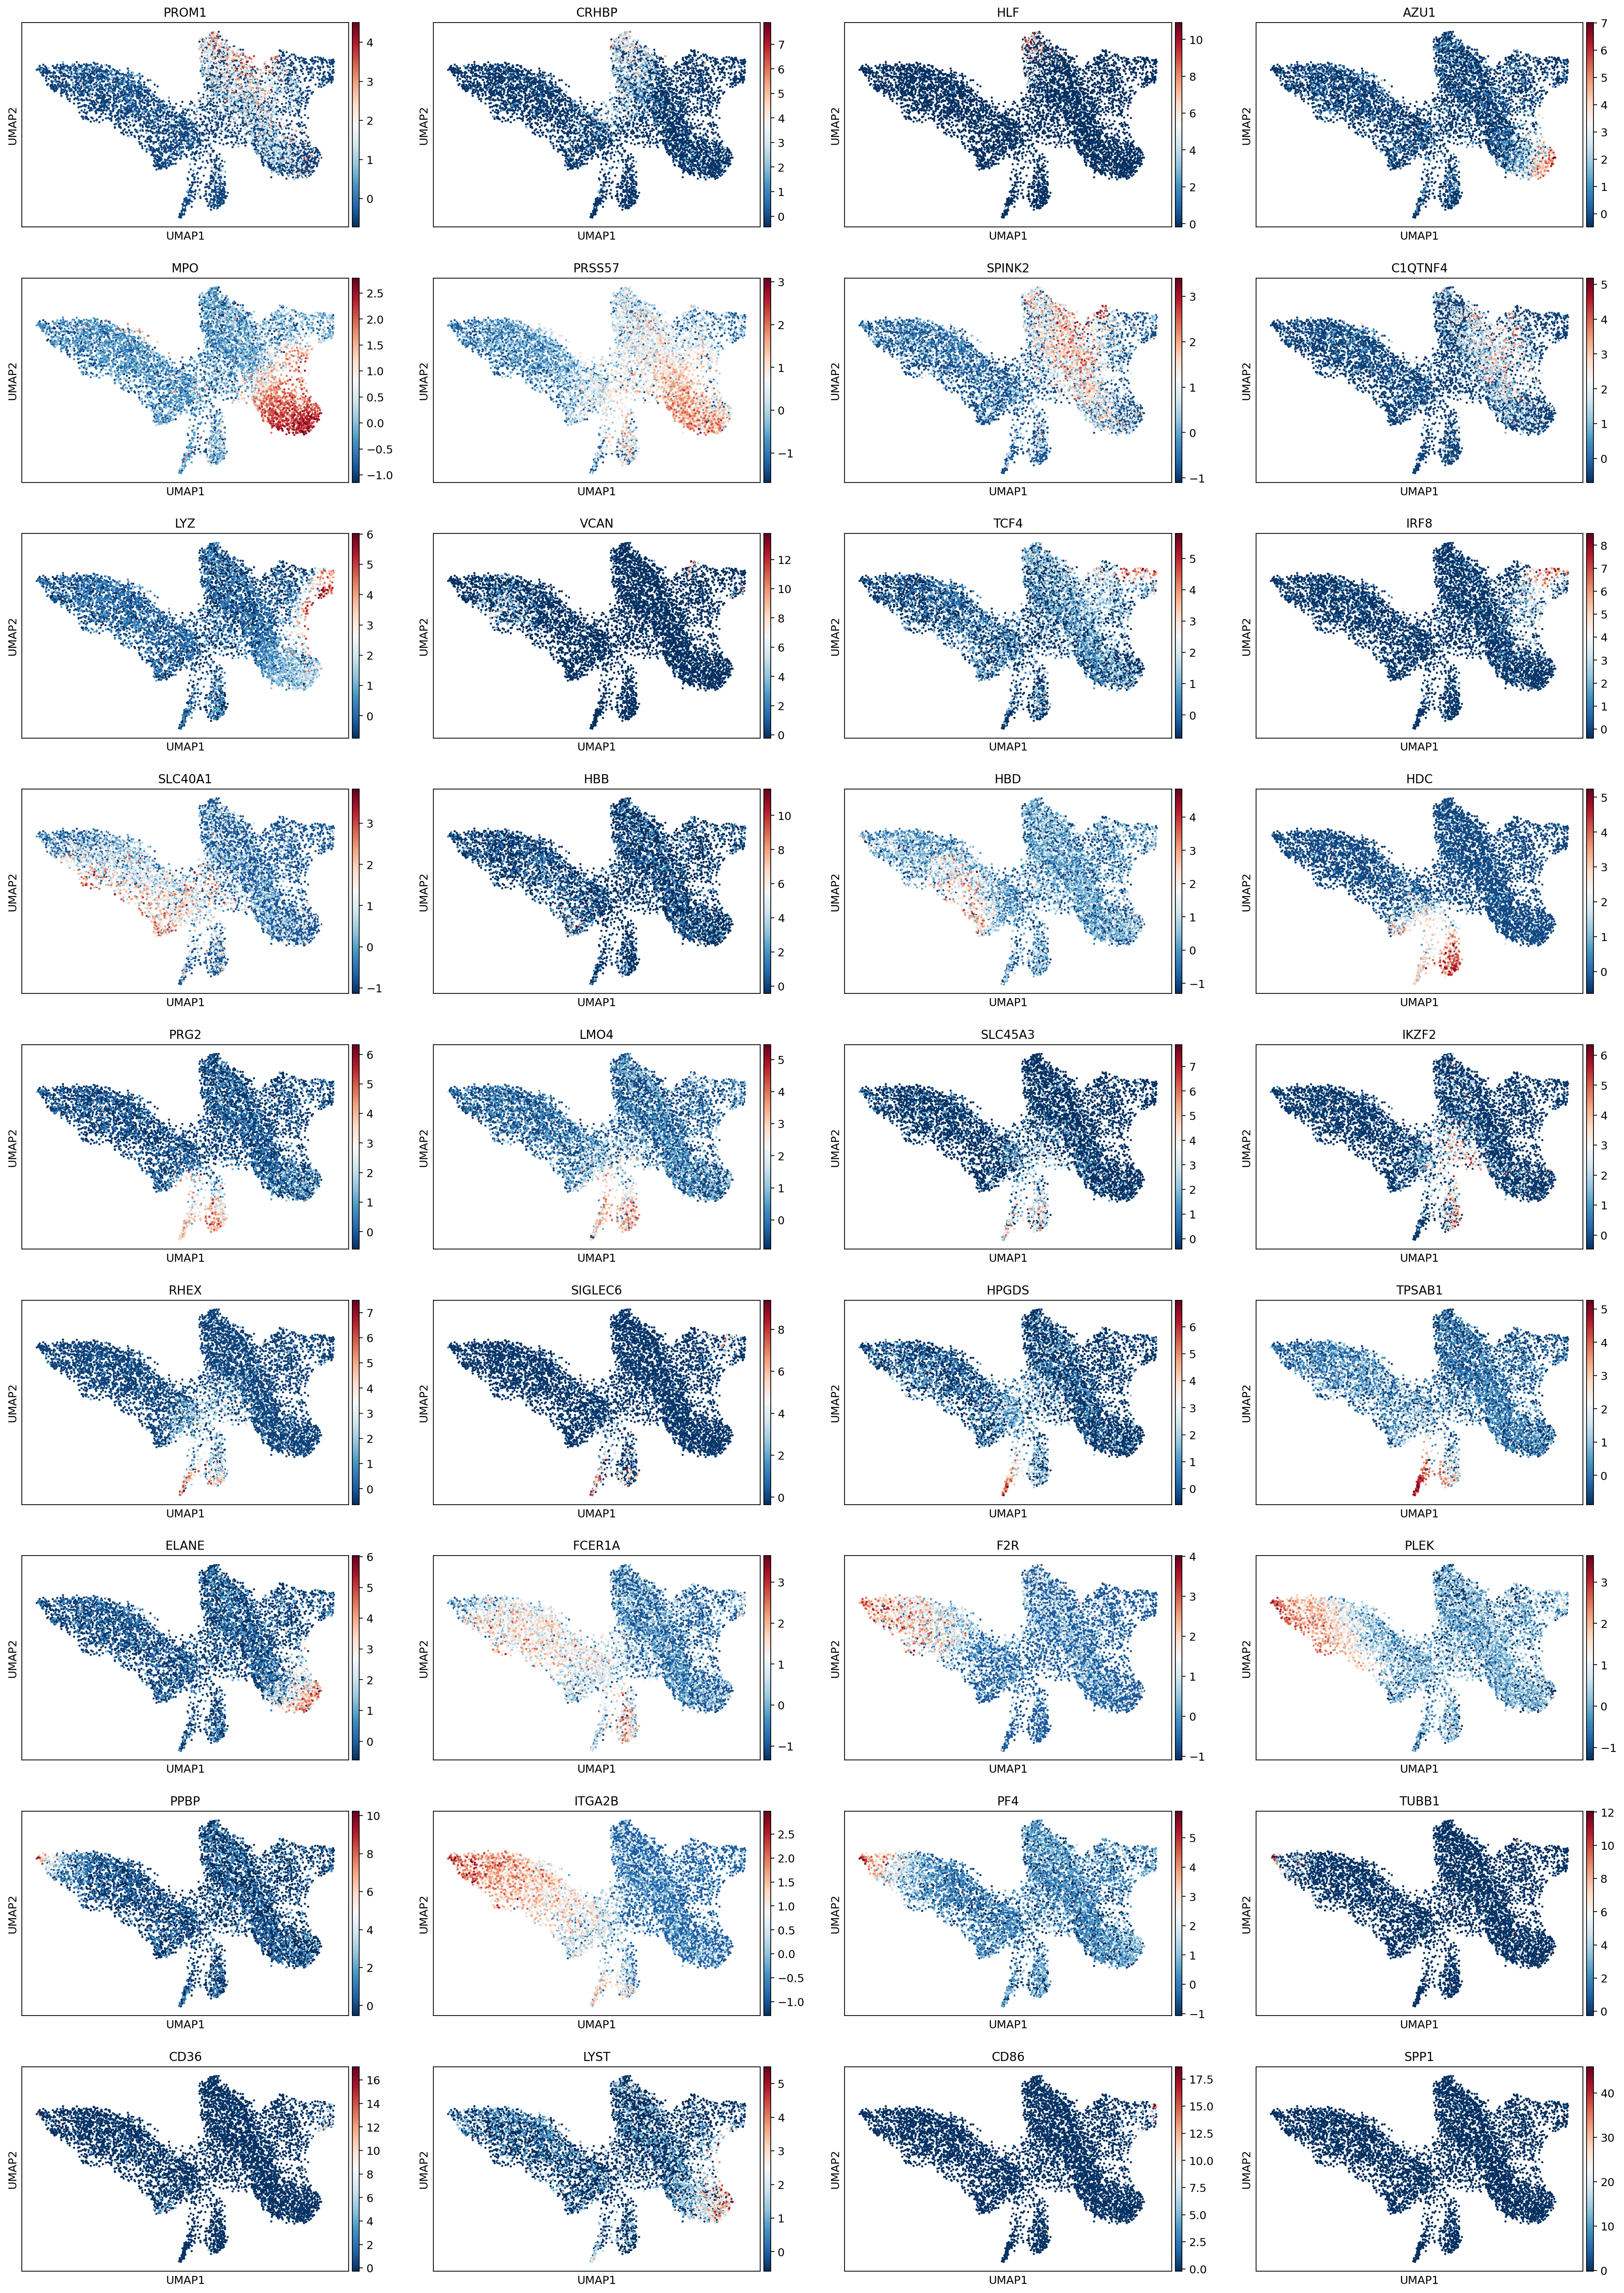
Visualize marker gene expressions on UMAP
[61]:
mg = marker_genes[np.isin(marker_genes, adata.var_names)]
sc.pl.umap(adata, color=mg)
/home/chen/.mambaforge/lib/python3.10/site-packages/scanpy/plotting/_tools/scatterplots.py:163: MatplotlibDeprecationWarning: The get_cmap function was deprecated in Matplotlib 3.7 and will be removed two minor releases later. Use ``matplotlib.colormaps[name]`` or ``matplotlib.colormaps.get_cmap(obj)`` instead.
  cmap = copy(get_cmap(cmap))
Cluster and annotation
[62]:
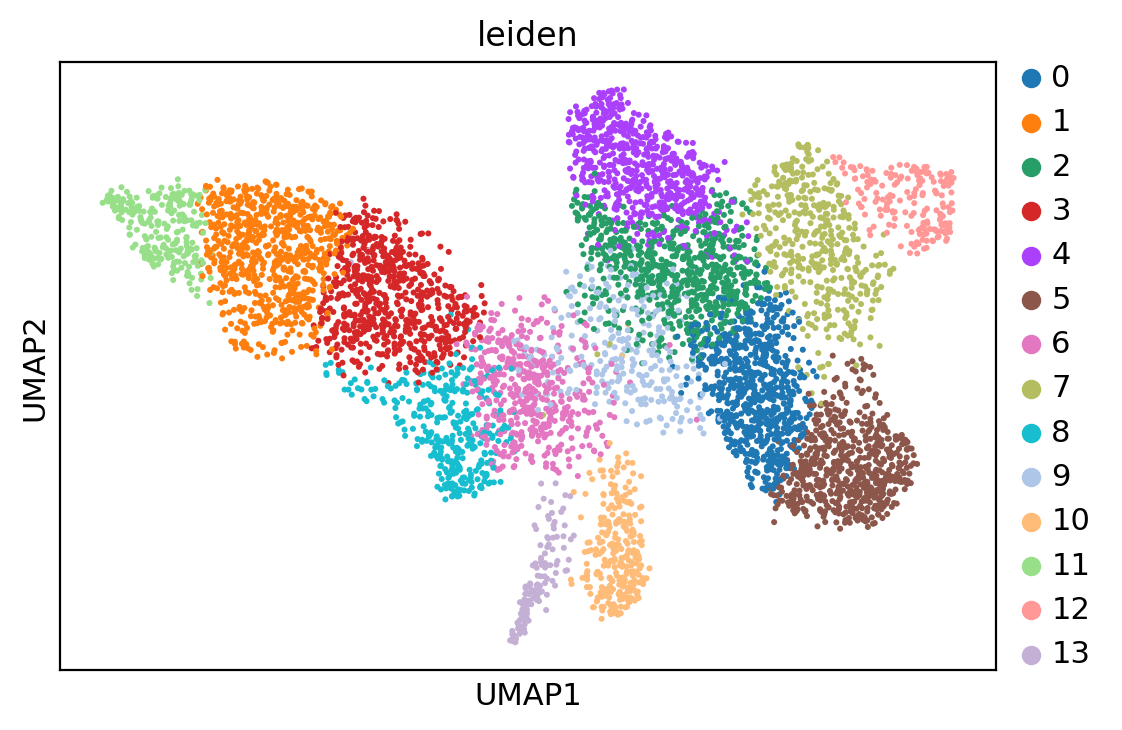
sc.tl.leiden(adata, resolution=1.6)
sc.pl.umap(adata, color='leiden')
/home/chen/.mambaforge/lib/python3.10/site-packages/scanpy/plotting/_tools/scatterplots.py:163: MatplotlibDeprecationWarning: The get_cmap function was deprecated in Matplotlib 3.7 and will be removed two minor releases later. Use ``matplotlib.colormaps[name]`` or ``matplotlib.colormaps.get_cmap(obj)`` instead.
  cmap = copy(get_cmap(cmap))
[ ]:
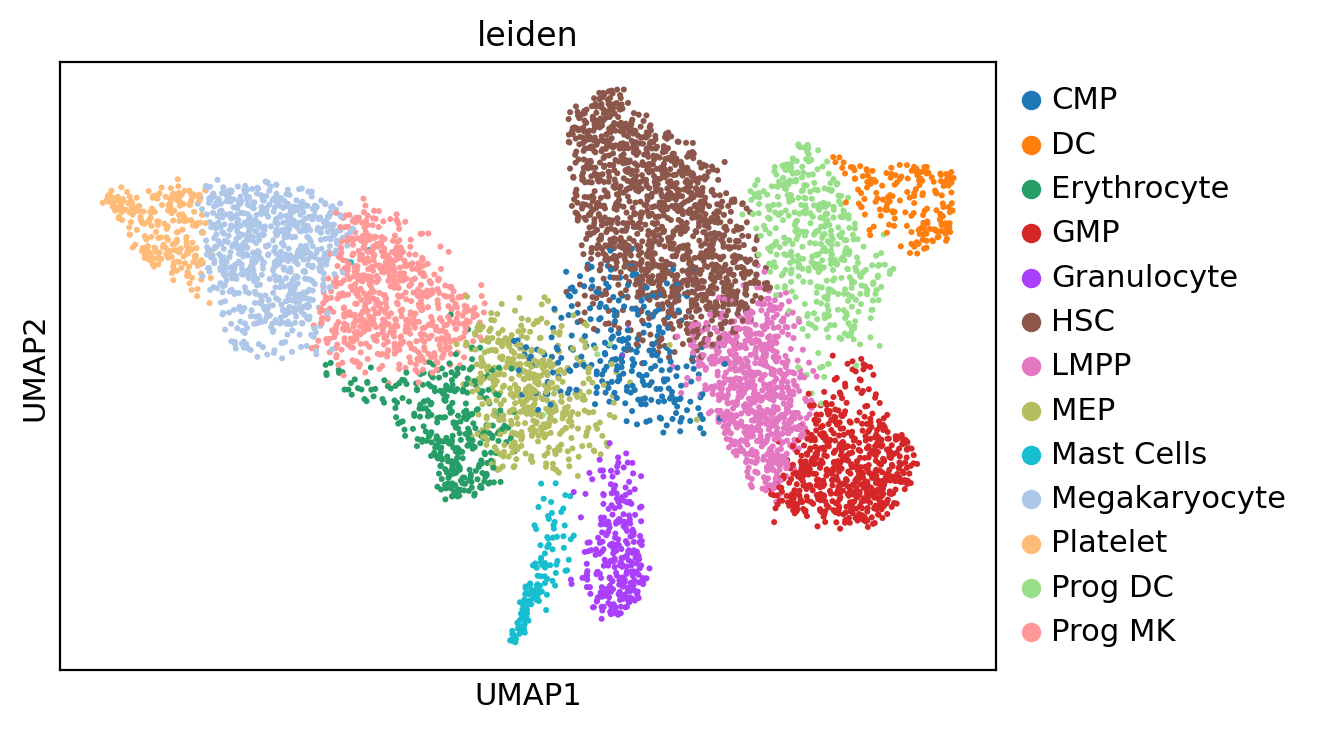
new_cluster_names = ['LMPP',
                     'Megakaryocyte',
                     'HSC 1',
                     'Prog MK',
                     'HSC 2',
                     'GMP',
                     'MEP',
                     'Prog DC',
                     'Erythrocyte',
                     'CMP',
                     'Granulocyte',
                     'Platelet',
                     'DC',
                     'Mast Cells'
                     ]
adata.rename_categories('leiden', new_cluster_names)
new_cluster_names = adata.obs['leiden'].to_numpy()
new_cluster_names[(new_cluster_names == 'HSC 1') | (new_cluster_names == 'HSC 2')] = 'HSC'
adata.obs['leiden'] = new_cluster_names
del adata.uns['leiden_colors']
sc.pl.umap(adata, color='leiden')
/home/chen/.mambaforge/lib/python3.10/site-packages/scanpy/plotting/_tools/scatterplots.py:163: MatplotlibDeprecationWarning: The get_cmap function was deprecated in Matplotlib 3.7 and will be removed two minor releases later. Use ``matplotlib.colormaps[name]`` or ``matplotlib.colormaps.get_cmap(obj)`` instead.
  cmap = copy(get_cmap(cmap))
[64]:
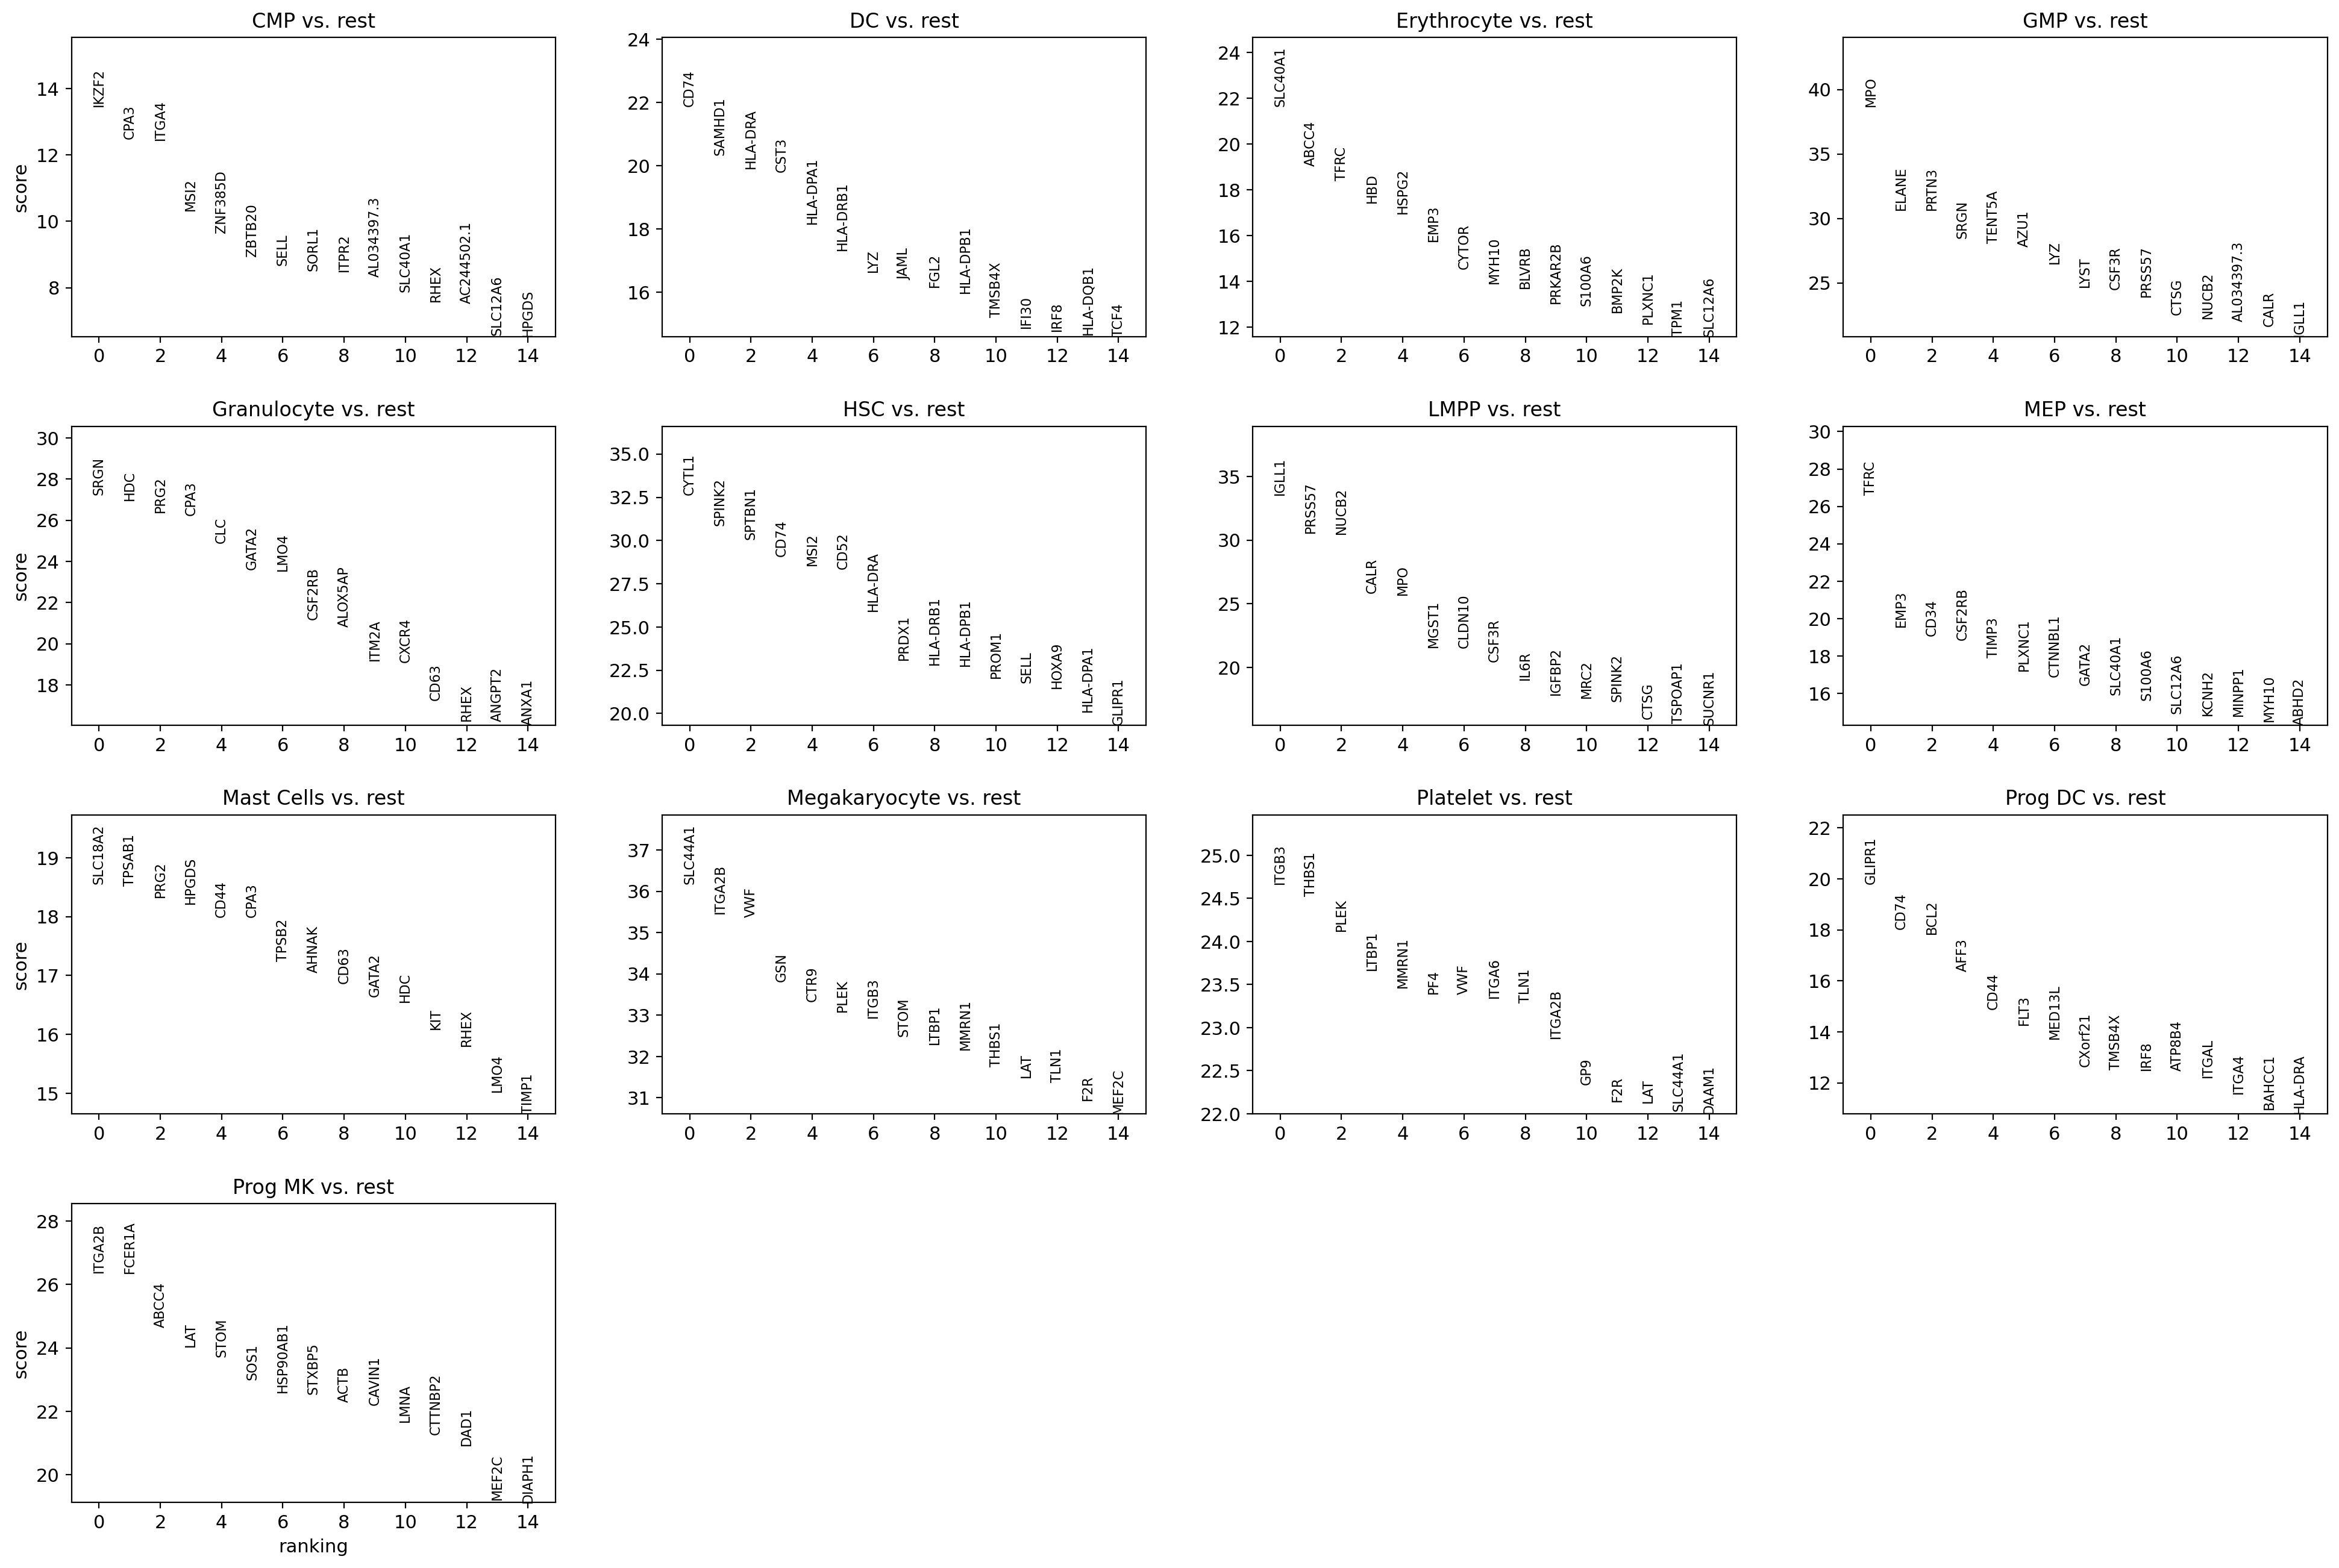
sc.tl.rank_genes_groups(adata, 'leiden', method='wilcoxon')
sc.pl.rank_genes_groups(adata, n_genes=15, sharey=False)
[65]:
adata
[65]:
AnnData object with n_obs × n_vars = 6336 × 816
    obs: 'total_unspliced', 'total_spliced', 'log1p_total_unspliced', 'log1p_total_spliced', 'fraction_u', 'n_genes_by_counts', 'log1p_n_genes_by_counts', 'total_counts', 'log1p_total_counts', 'pct_counts_in_top_20_genes', 'total_counts_mt', 'log1p_total_counts_mt', 'pct_counts_mt', 'total_counts_rb', 'log1p_total_counts_rb', 'pct_counts_rb', 'total_counts_hla', 'log1p_total_counts_hla', 'pct_counts_hla', 'total_counts_hb', 'log1p_total_counts_hb', 'pct_counts_hb', 'outlier', 'initial_size_unspliced', 'initial_size_spliced', 'initial_size', 'n_counts', 'S_score', 'G2M_score', 'phase', 'CC_difference', 'total_unspliced2', 'total_spliced2', 'log1p_total_unspliced2', 'log1p_total_spliced2', 'fraction_u2', 'n_c', 'n_Mu', 'n_Ms', 'leiden'
    var: 'gene_ids', 'feature_types', 'HVG', 'n_cells', 'mt', 'rb', 'hla', 'hb', 'n_cells_by_counts', 'mean_counts', 'log1p_mean_counts', 'pct_dropout_by_counts', 'total_counts', 'log1p_total_counts', 'gene_count_corr', 'highly_variable', 'mean', 'std'
    uns: 'log1p', 'pca', 'neighbors', 'umap', 'leiden', 'leiden_colors', 'rank_genes_groups'
    obsm: 'X_pca', 'X_umap'
    varm: 'PCs'
    layers: 'spliced', 'unspliced', 'Ms', 'Mu'
    obsp: 'distances', 'connectivities'
Prepare Seurat WNN
[66]:
with open('filtered_cells.txt', 'w', newline ='') as f:
    writer = csv.writer(f, delimiter=',')
    writer.writerows(adata_atac.obs_names[:,None])
with open('leiden.txt', 'w', newline ='') as f:
    writer = csv.writer(f, delimiter=',')
    writer.writerows(np.array(adata.obs['leiden'].values)[:,None])
[67]:
### Run seurat_wnn.R ###
[68]:
nn_idx = np.loadtxt("seurat/nn_idx.txt", delimiter=',')
nn_dist = np.loadtxt("seurat/nn_dist.txt", delimiter=',')
nn_cell_names = list(pd.read_csv("seurat/nn_cell_names.txt", header=None)[0])
nn_idx.shape
[68]:
(6336, 50)
[69]:
np.all(nn_cell_names == adata.obs_names)
[69]:
True
[70]:
adata_atac.obs['leiden'] = adata.obs['leiden']
Smooth accessibilities by neighbors
[71]:
vv.model.knn_smooth_chrom(adata_atac, nn_idx, nn_dist)
[72]:
adata, adata_atac
[72]:
(AnnData object with n_obs × n_vars = 6336 × 816
     obs: 'total_unspliced', 'total_spliced', 'log1p_total_unspliced', 'log1p_total_spliced', 'fraction_u', 'n_genes_by_counts', 'log1p_n_genes_by_counts', 'total_counts', 'log1p_total_counts', 'pct_counts_in_top_20_genes', 'total_counts_mt', 'log1p_total_counts_mt', 'pct_counts_mt', 'total_counts_rb', 'log1p_total_counts_rb', 'pct_counts_rb', 'total_counts_hla', 'log1p_total_counts_hla', 'pct_counts_hla', 'total_counts_hb', 'log1p_total_counts_hb', 'pct_counts_hb', 'outlier', 'initial_size_unspliced', 'initial_size_spliced', 'initial_size', 'n_counts', 'S_score', 'G2M_score', 'phase', 'CC_difference', 'total_unspliced2', 'total_spliced2', 'log1p_total_unspliced2', 'log1p_total_spliced2', 'fraction_u2', 'n_c', 'n_Mu', 'n_Ms', 'leiden'
     var: 'gene_ids', 'feature_types', 'HVG', 'n_cells', 'mt', 'rb', 'hla', 'hb', 'n_cells_by_counts', 'mean_counts', 'log1p_mean_counts', 'pct_dropout_by_counts', 'total_counts', 'log1p_total_counts', 'gene_count_corr', 'highly_variable', 'mean', 'std'
     uns: 'log1p', 'pca', 'neighbors', 'umap', 'leiden', 'leiden_colors', 'rank_genes_groups'
     obsm: 'X_pca', 'X_umap'
     varm: 'PCs'
     layers: 'spliced', 'unspliced', 'Ms', 'Mu'
     obsp: 'distances', 'connectivities',
 AnnData object with n_obs × n_vars = 6336 × 816
     obs: 'n_counts', 'leiden'
     layers: 'Mc'
     obsp: 'connectivities')
Save post-processed AnnData
[73]:
adata.write_h5ad('8489-MV-1_adata_postpro.h5ad')
adata_atac.write_h5ad('8489-MV-1_adata_atac_postpro.h5ad')
[ ]: